




Organizational charts are a simple but effective way to illustrate hierarchical structures, and are sometimes referred to as organigrams, organograms, or Organizational Breakdown Structures (OBS). They can be used to represent hierarchies of any type, including taxonomies or ontologies. However, they are more frequently used to represent role hierarchies within a company or organization. A basic organizational chart for a business helps you visualize all the roles and how they relate to each other. Depending on the intended use for the chart – internal or external – you can include additional information, such as the names or contact details of employees.
An org chart shows who reports to whom. If you need to show how a total breaks down into parts instead, a pie chart in Google Sheets is the better fit.
In this guide, you will learn how to make an organizational chart in Google Sheets. First, you will learn how to set up the data to create a simple organizational chart, including only the roles or job titles. After that, you will learn how to add a third column to include more information in the form of tooltips, like employee names. Finally, you will learn how to set up the data to include more information in each column, like adding the employee names below the title or including multiple items in the tooltips.
How to create an organizational chart in Google Sheets?
Set up the relevant data in columns; for example, a column with roles and another with the role they report to. Select both columns and go to Insert > Chart. If the ‘Organizational chart’ type isn’t inserted automatically, click the ‘Chart type’ drop-down to select it.
Depending on the kind of organizational chart you want to make, you can use different types of information in your columns. In the example below, I want to create a chart that only includes employee job titles and supervisor job titles. In later sections, you will learn how to add columns with additional information that can be shown as tooltips or directly within the chart.
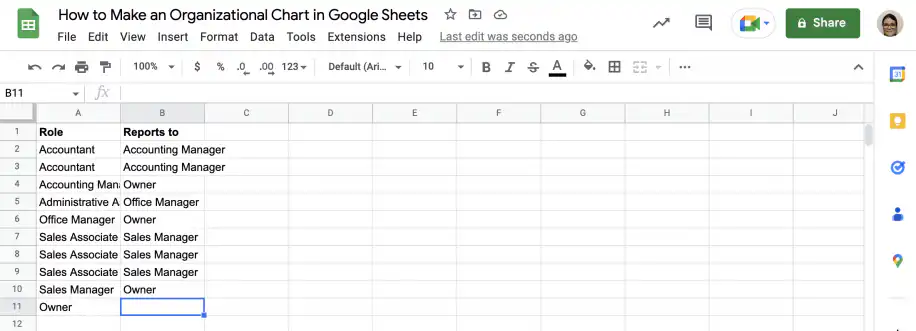
1. Set up data
In the first column, include all the roles or employee job titles that you want to include in the organizational chart. In the second column, you should list the supervisor each role reports to.
2. Insert chart
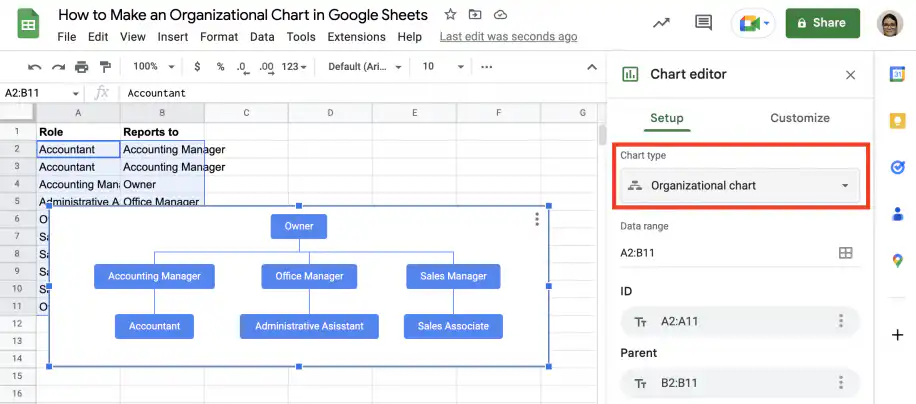
Select both columns and go to Insert > Chart. Under ‘Chart type’, scroll down to ‘Other’ and select the ‘Organizational chart’.
3. Customize chart
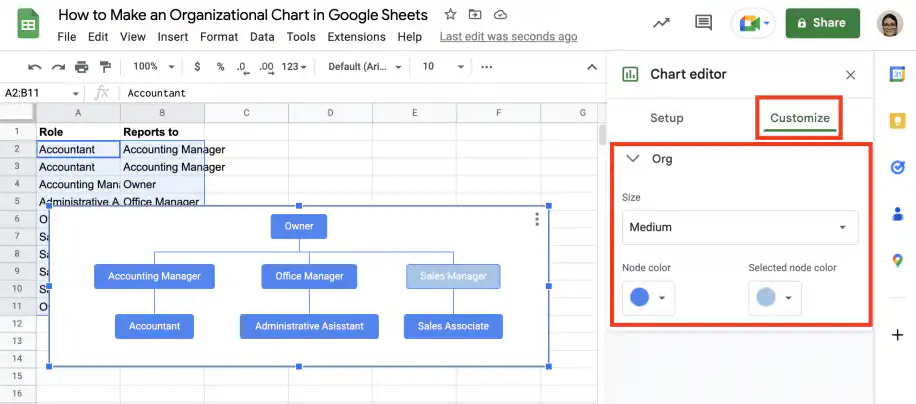
Go to the ‘Customize’ tab in the ‘Chart editor’ and click ‘Org’ to show the options. You can change the size of the chart, and choose both the selected and unselected colors for the nodes.
How to download or export your organizational chart?
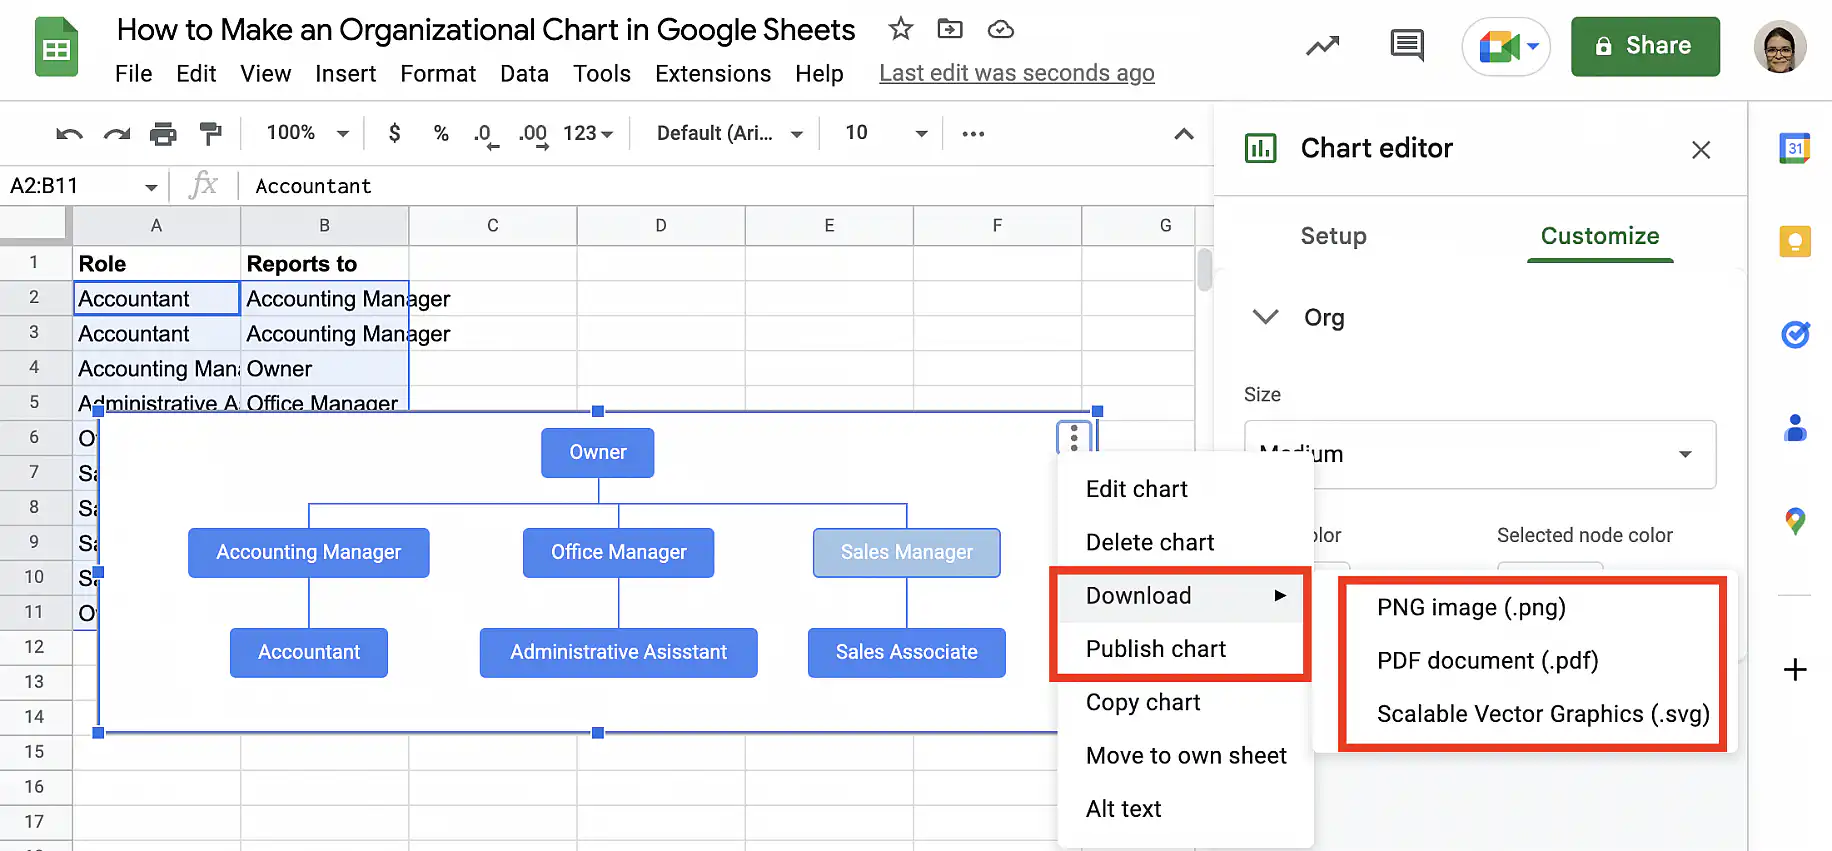
Select the chart and click on the vertical ellipsis in the top-right corner. Select ‘Download’ and choose the format you prefer:
Examples of organizational charts in Google Sheets
Now that you know how to make a simple organizational chart with the roles or job titles, it’s time to learn how to include additional information. In the first example, you will learn how to add a column to use the tooltips to display the names. In the second example, you will learn how to add the names below the title in the nodes. Finally, in the third example, you will learn how to include more than one item of information in the tooltips.
Example 1. Add name column to show as tooltip
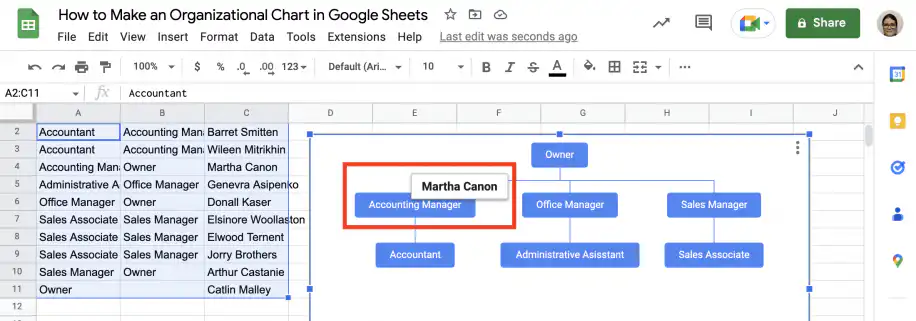
If you don’t want employee names to appear on the chart itself, you can include them as tooltips. The names will appear when users hover over each node.
1. Add a third column with the employee names, in the order they appear in the first column.
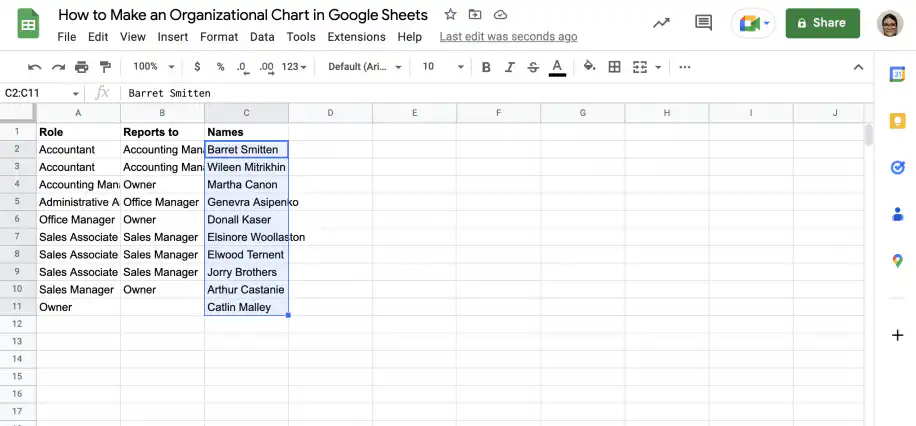
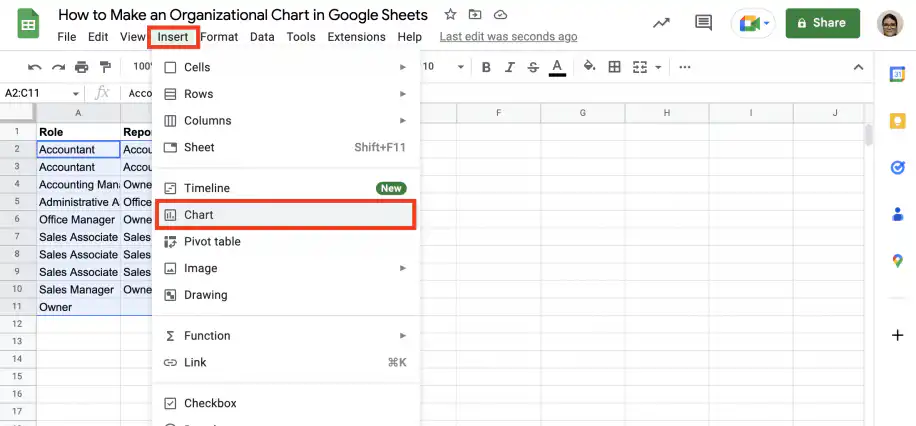
2. Select the data in all three columns and go to Insert > Chart.
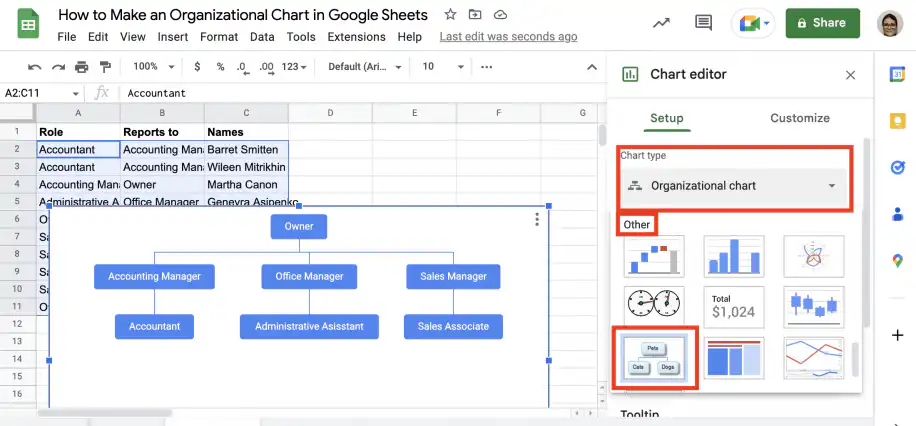
3. Under ‘Chart type’, scroll down to ‘Other’ and select ‘Organizational chart’.
4. When you hover over a node in the chart, you will see a tooltip with the employee’s name.
Example 2. Add names under job titles
If you want to see the names below the job titles in the organizational chart’s nodes, you can join the cell contents with the Google Sheets TEXTJOIN function and the new line character, CHAR(10).
1. Add a new column and type the TEXTJOIN function in the first cell. Use CHAR(10) as the delimiter and TRUE as the second parameter.
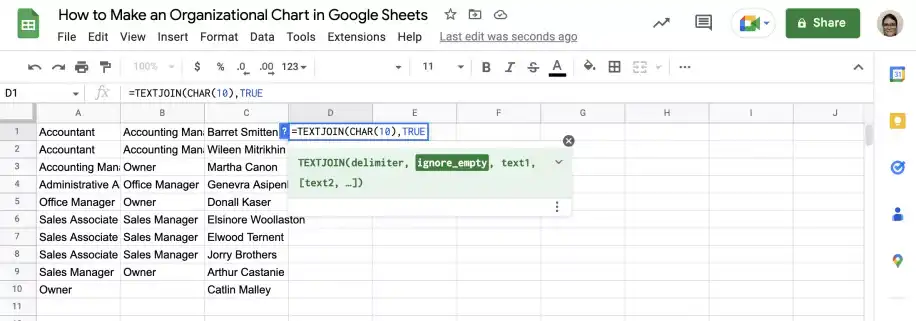
2. Add a comma and select the first cell in the first column. Add another comma and select the first cell in the second column.
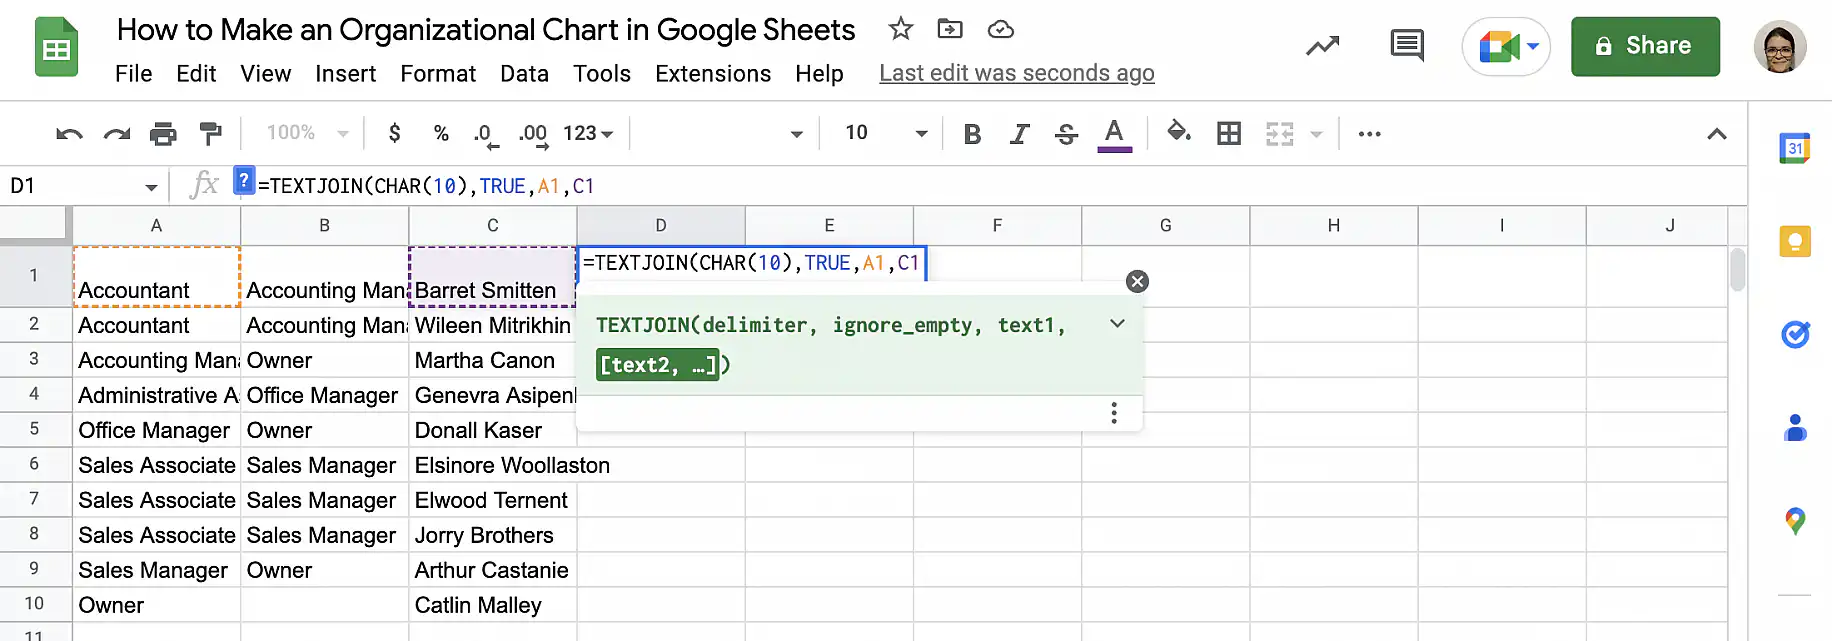
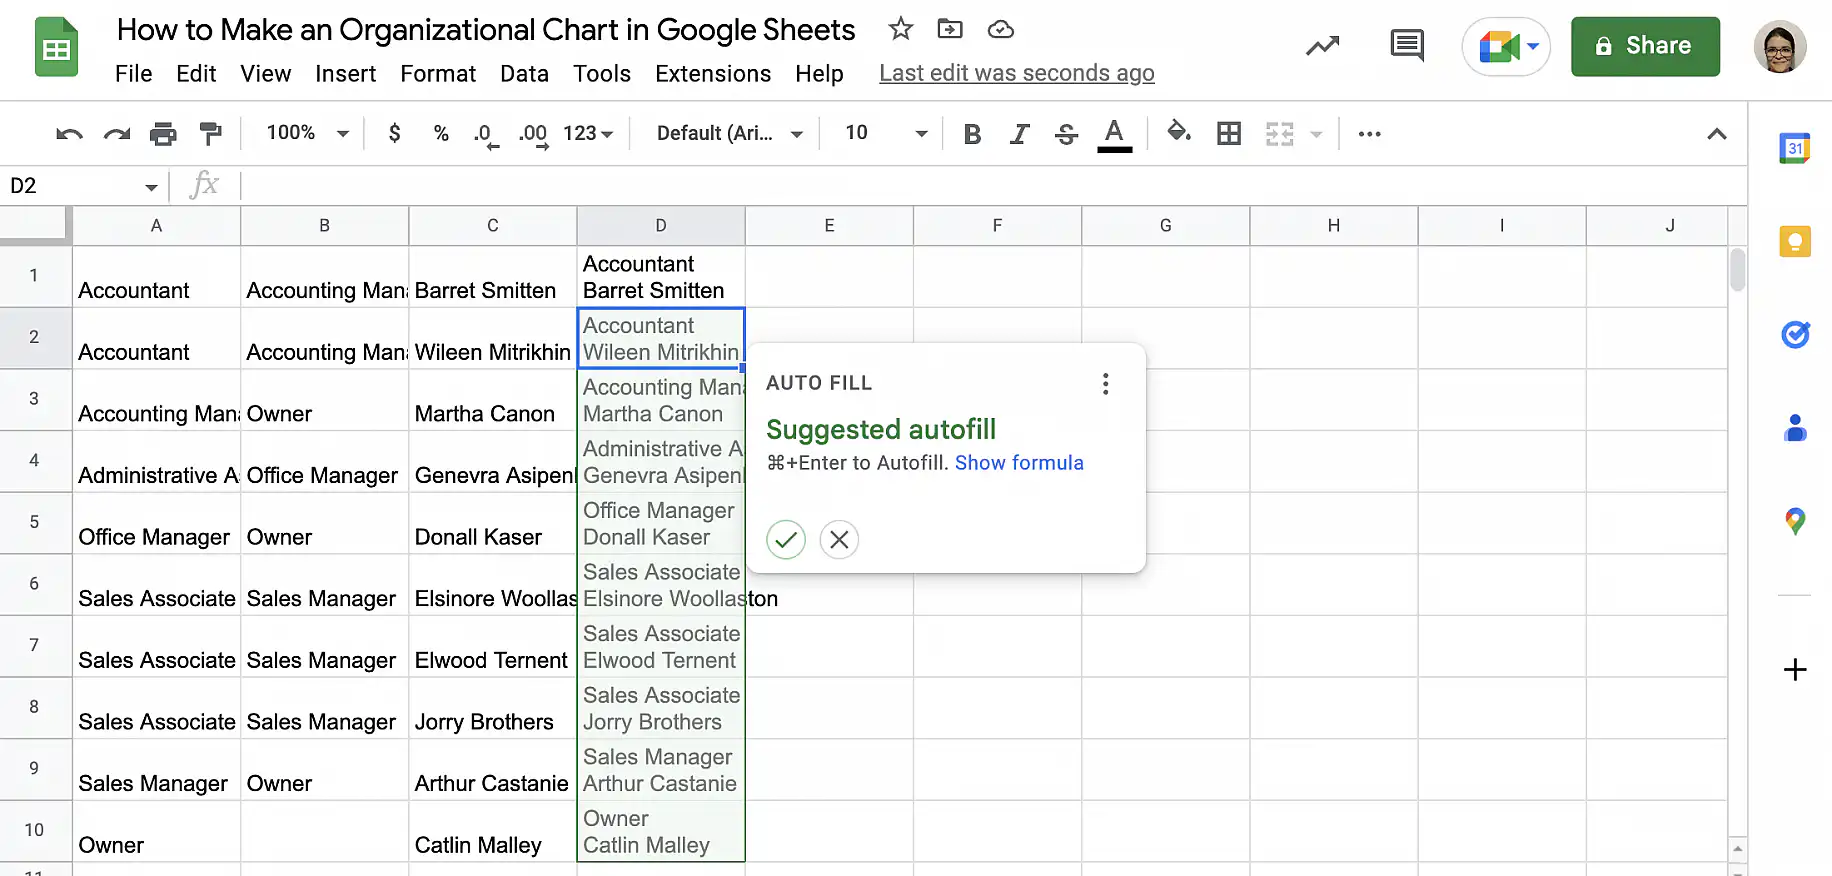
3. Close the parenthesis and press ‘Enter’. Accept the suggested autofill to copy the formula down.
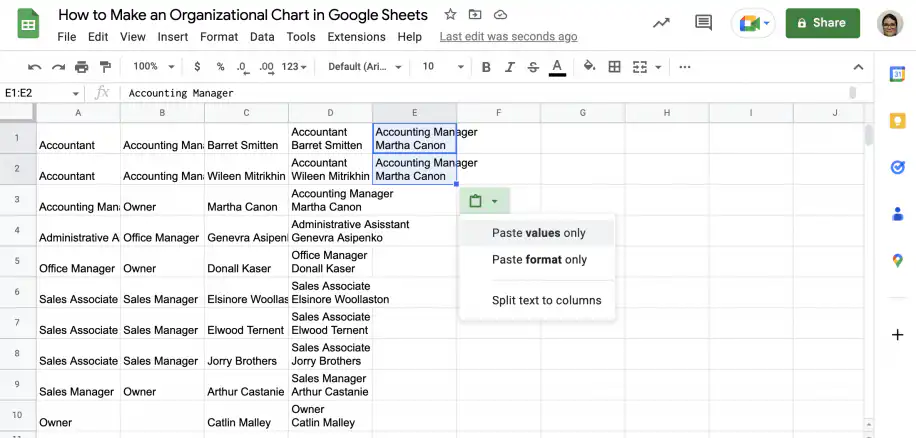
4. Add another column for the supervisors. Remember to copy from the column you added in the previous step, so the contents match.
5. Select the two new columns and go to Insert > Chart. Under ‘Chart type’, choose ‘Organizational chart’.
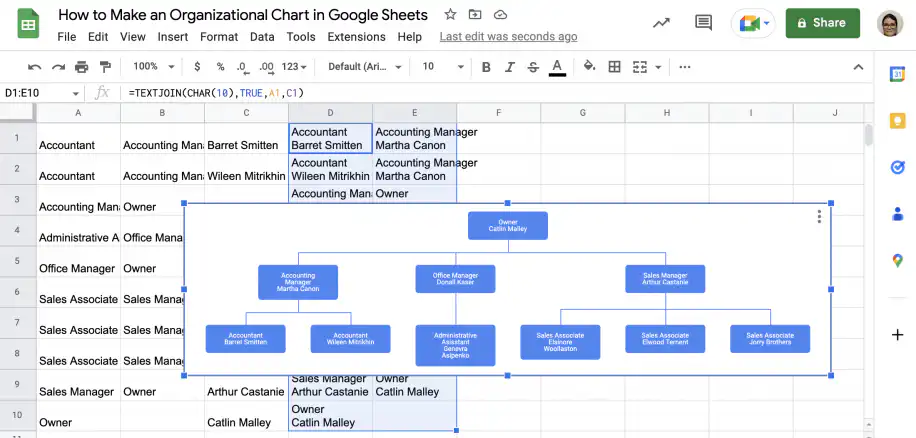
Example 3. How to make an organizational chart with name & email in tooltips
Imagine you’re creating an organization chart for internal use, such as onboarding. You want to include only the job title in the chart to keep it uncluttered, but also show the employee’s name and email address in the tooltip. You will need to list the roles in the first column and the role they report to in the second, just like in the first section. The third column should contain the content you want to show in the tooltips. In this case, you want a combination of the name and the email address.
1. To create the third column, you can use TEXTJOIN or the ampersand (&) symbol to join the name and email. The tooltip is displayed on a single line, but I will add the CHAR(32) character to insert a space between them.
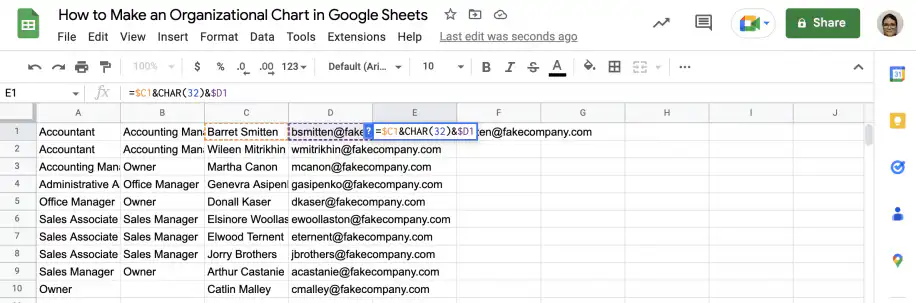
2. Copy the formula down using the fill handle.
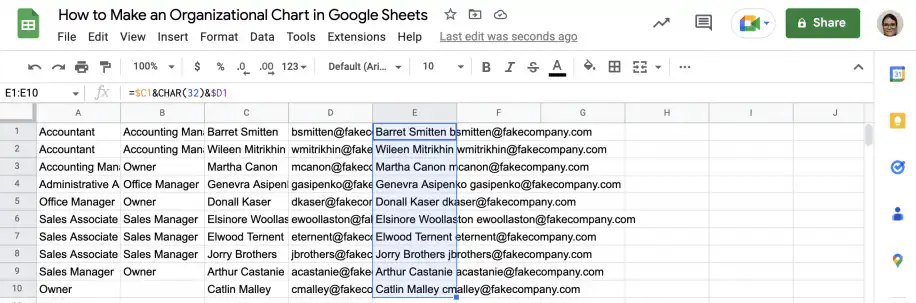
3. Select the first two columns and hold down Ctrl or Cmd to select the column you just created.
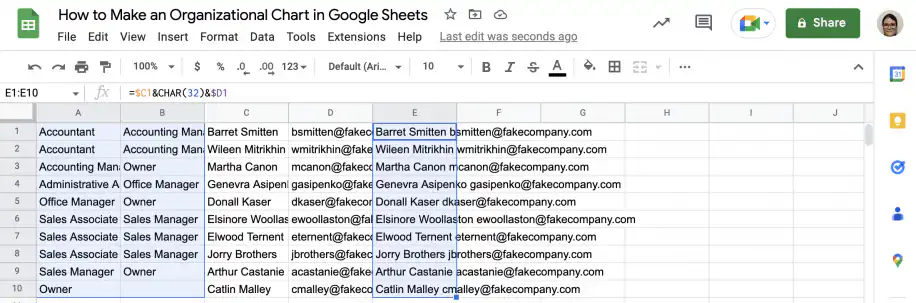
4. Go to Insert > Chart and select ‘Organizational chart’ under ‘Chart type’.
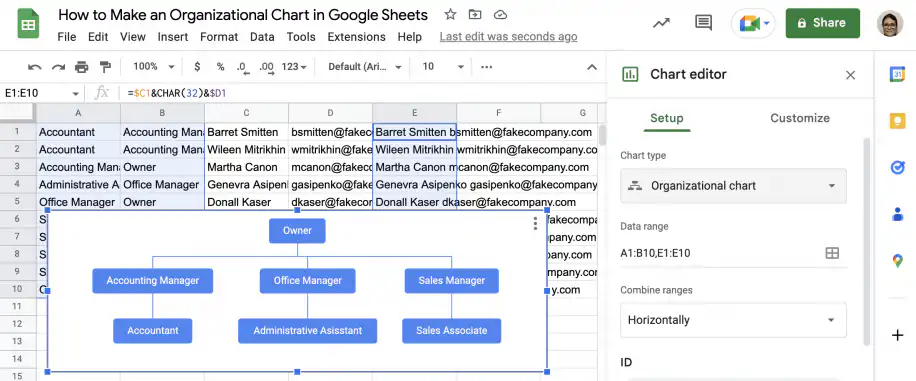
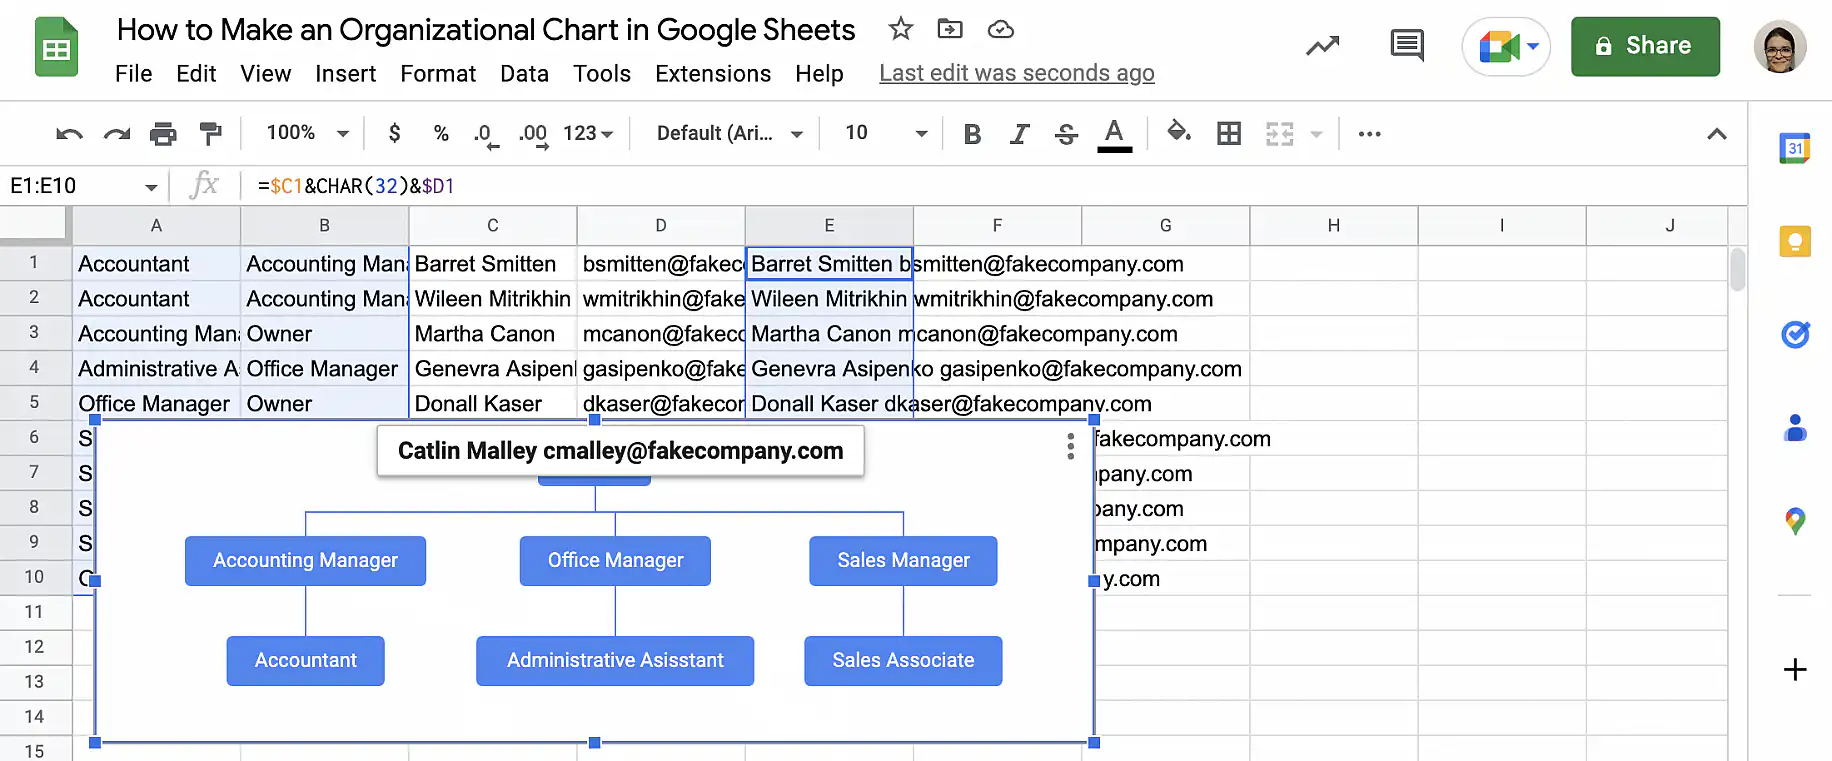
5. As you can see, the tooltip now shows the name and email address of the employee when you hover over each node.
Conclusion
Creating organizational charts in Google Sheets is easy. You can illustrate hierarchies easily and include as much or as little information as you want. The tooltip feature also allows you to provide information that isn’t visible on the chart itself. You now know how to create a simple organizational chart that only includes roles or job titles. You also know how to add a third column with the information you want to include as tooltips. Additionally, you know how to combine data to display multiple items in each node and in the tooltips.
To learn more about how to create other types of charts in Google Sheets, check out our guides on:

 English
 Español
 Português do Brasil
 Français