


In its most basic form, a Gantt chart is a bar chart showing tasks and time – or a schedule of what activities need doing and when. More advanced versions include other information such as who is responsible for each task, how different tasks relate to each other (dependencies) and what resources are required.
Because it’s cloud-based (online) software, Google Sheets always contains real-time data and every change is saved automatically. This means that the entire team can make updates to the same file from any location, at any time.
This guide shows you how to make a Gantt chart in Google Sheets from a stacked bar chart, step by step, and how to link tasks with dependencies. If you’d rather start from a ready-made Google Sheets Gantt chart, use the template in the next section.
Gantt chart template for Google Sheets
A project management template saves you the setup. The one below is a master sheet with a WBS tab and a Gantt tab, and it lets you:
- Break the project into phases and tasks, each with an owner, a start date, and an end date.
- Link tasks with finish-to-start or start-to-start dependencies.
- See which tasks are behind, on schedule, or ahead as your team reports progress.
Use an automated Gantt chart template
Google Sheets has powerful collaboration functions. But if you’re managing a complex project or multiple projects, you might not want multiple colleagues working on (and changing) the same spreadsheet. As a project manager, it’s already a challenge to keep track of everything. And it’s often safer and more streamlined if you keep data flows segregated.
The Sheetgo Project Management workflow template contains input sheets for your colleagues. Here they can update the status of their tasks. The data from these input sheets flows automatically (via Sheetgo connections) straight into your master sheet. Likewise, when you enter or update task information in your master sheet (such as extending the end date) that data is automatically exported to your team’s spreadsheets.
Check out the Sheetgo project management template. If you’d rather not keep the sheet up to date yourself, Sheetgo also has Milo, an AI virtual employee who assigns tasks, maps dependencies, and keeps the project sheet current. He works in the spreadsheets your team already uses and checks with a person before anything consequential.

Get an at-a-glance overview of your project timeline in the automated Gantt chart:

How to make a Gantt chart in Google Sheets
Gantt charts can be intimidating if you don’t know the components or what you can achieve with them. However, once you understand these components and how they work together, you’ll be able to create your own. Follow the steps below to create a Gantt chart in Google Sheets.
Set up the table
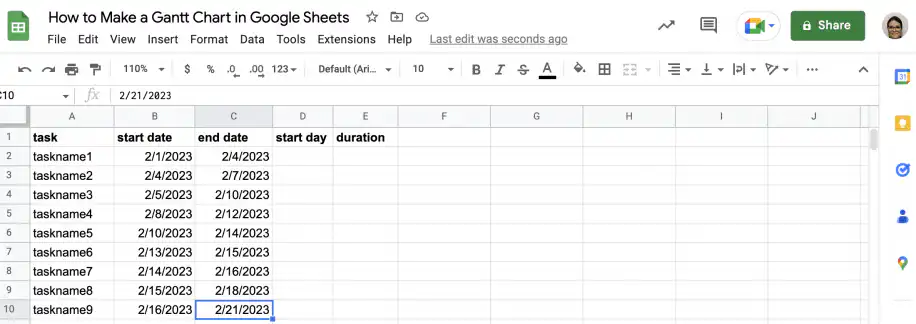
Open Google Sheets and go to the sheet where you want your Gantt chart. The first step is to build a table to keep track of the start and end dates for each task, which we will use to work out the start day and the duration of each task.
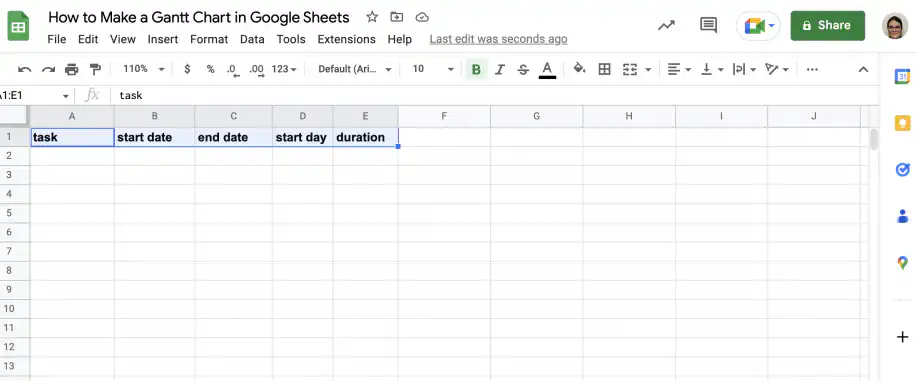
1. First, add the headers you need for the table: task, start date, end date, start day, and duration.
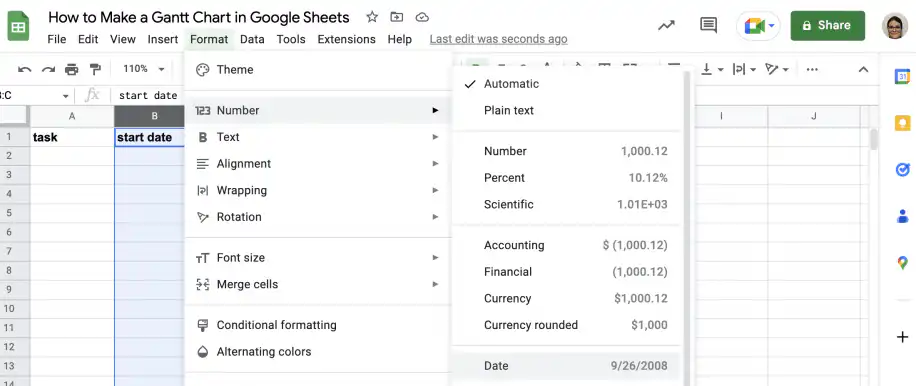
2. Select the columns with the start and end dates. Go to Format > Number > Date.
Add your project data
Now that you’ve set up the table, you need to add your project data. You’ll need to add each task to the table, starting with the earliest task.
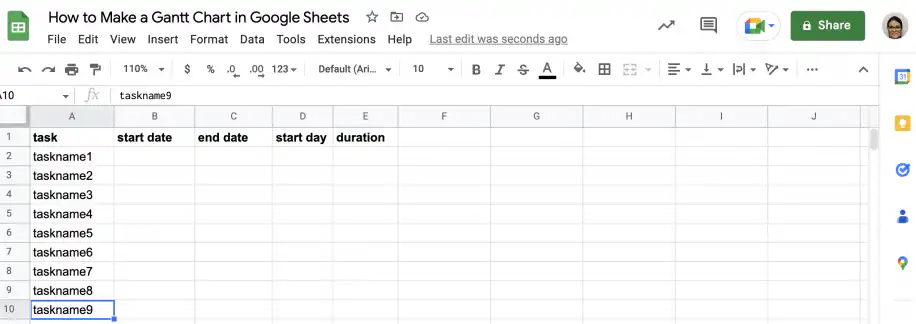
1. In the first column, add the relevant task names.
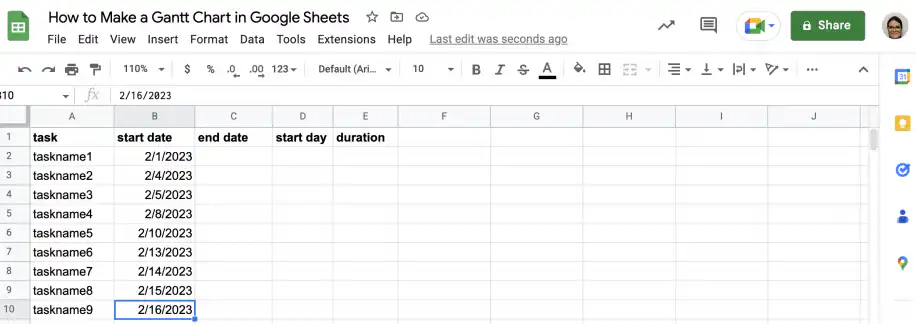
2. In the second column, add the start date for each task.
3. In the third column, add the end date for each task.
Calculate the start day and duration
Using the data added in the previous step, you can work out the start day and duration of each task. Fortunately, Google Sheets has a very useful function to do this for you: the DATEDIF function. For the start day, we need the difference between each task’s start date and the earliest start date, which is the start date for task 1.
1. To calculate the start day, type in the DATEDIF function.
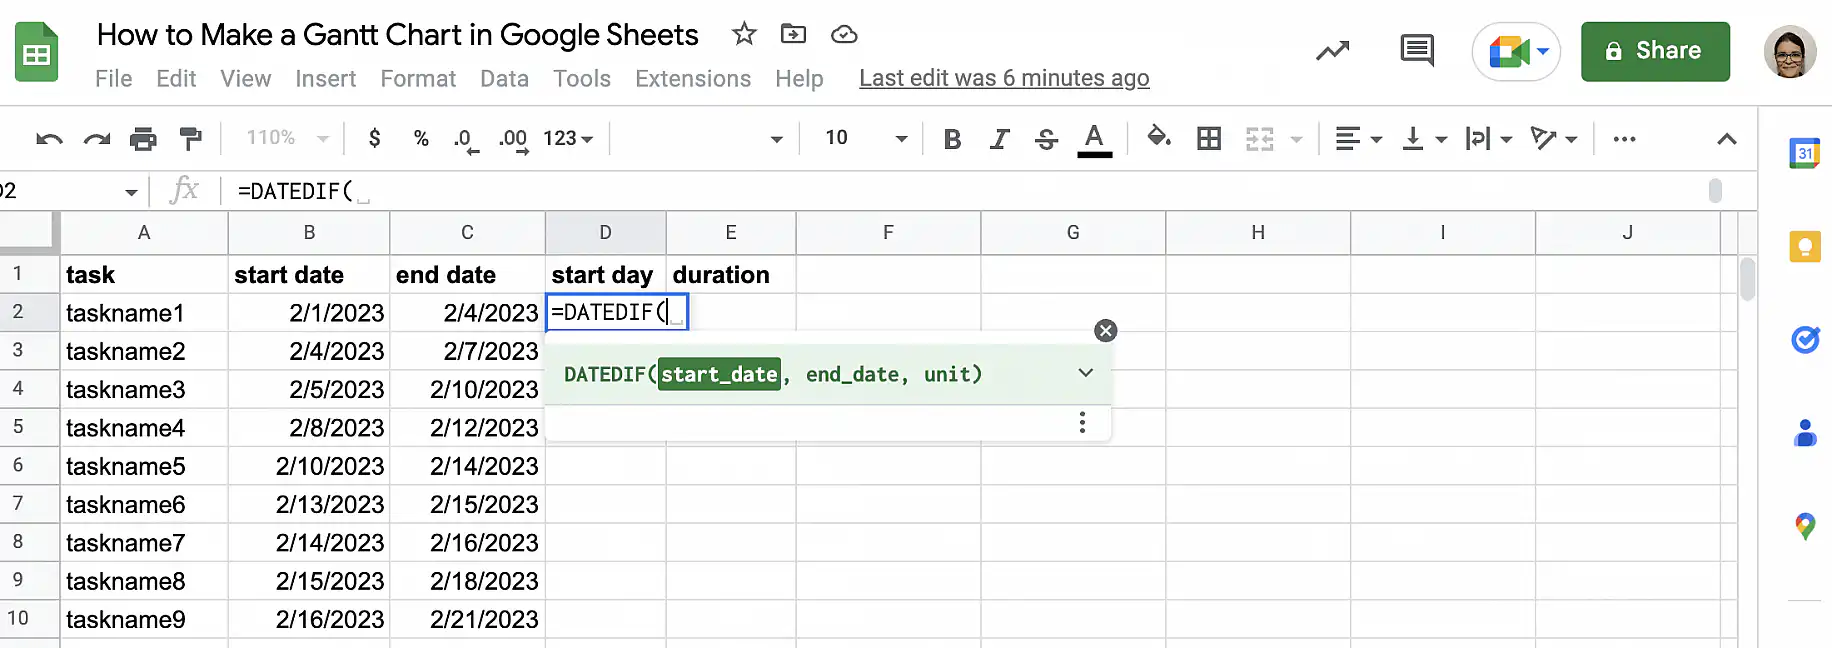
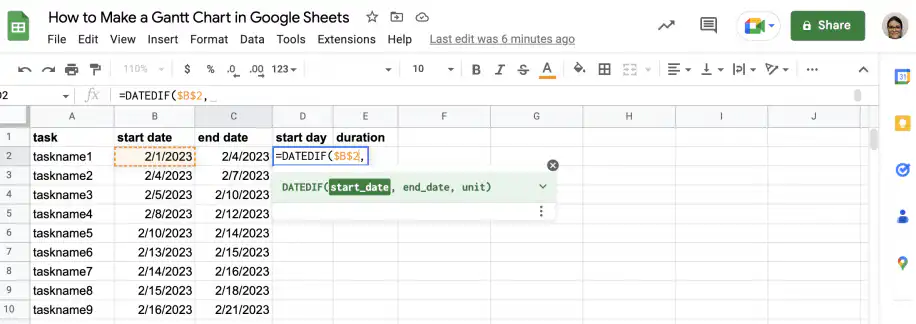
2. The first parameter is the start date for the project, which is the same as the start date for the first task. Use absolute referencing for the start date so you can copy the formula down.
3. For the second parameter (end_date), select the first task’s start date, but with relative referencing – no dollar symbols – so that you can copy the formula down to the other tasks.
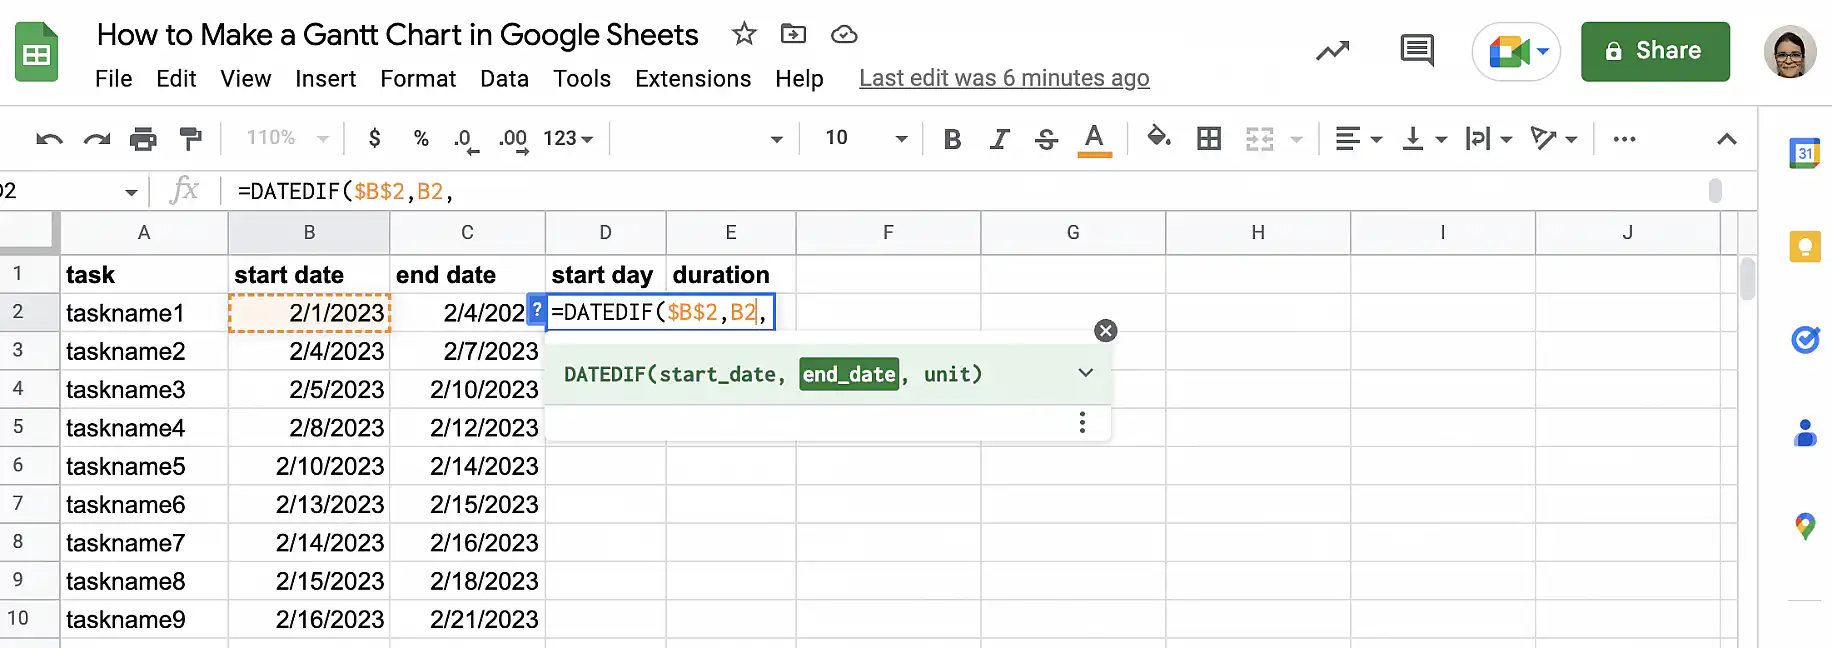
4. The last parameter indicates the unit, so you need to use “D” to get the result in days.
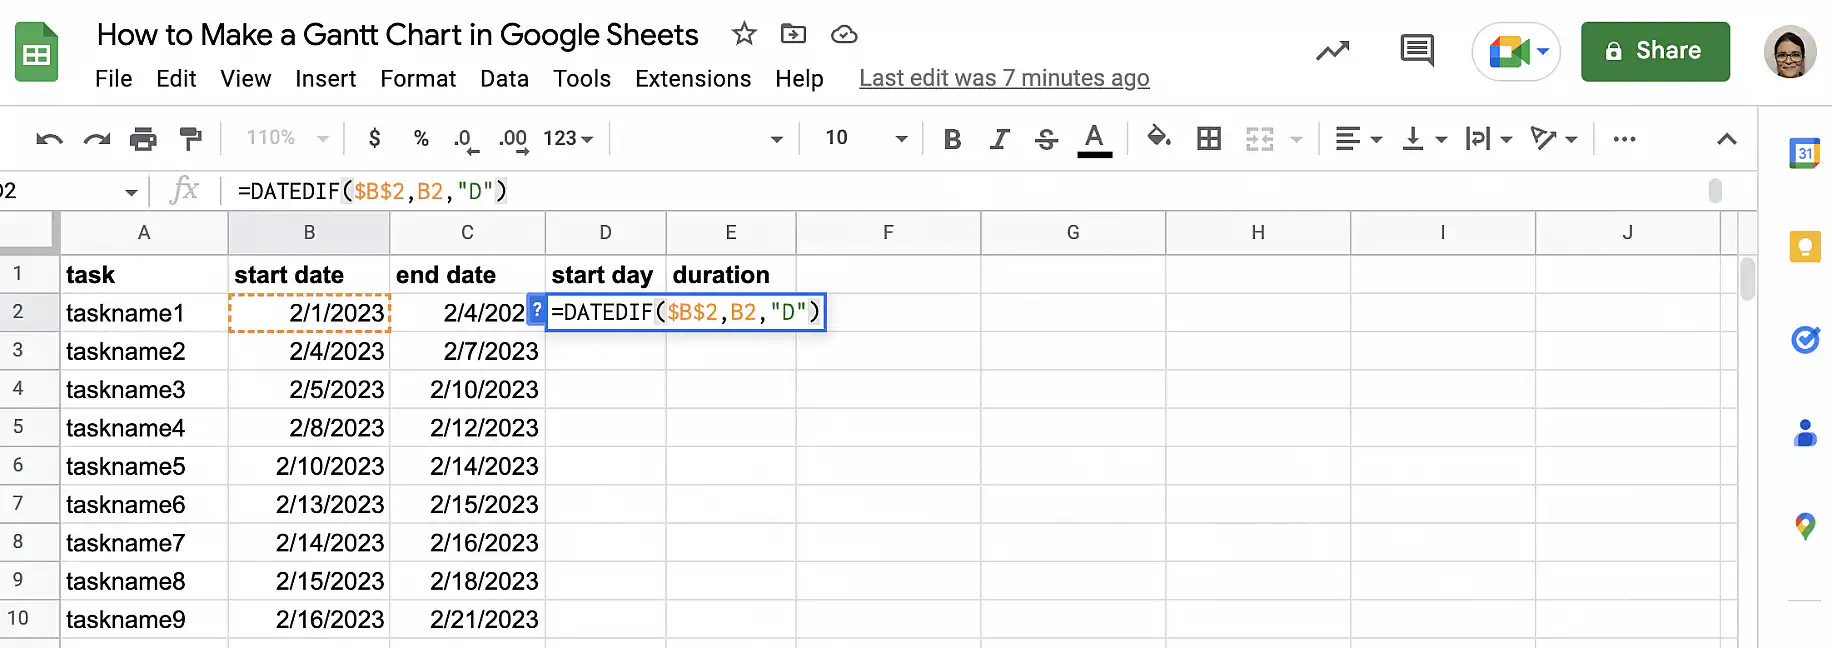
5. You can use the suggested autofill or simply grab the cell’s fill handle and drag it down to the last task.
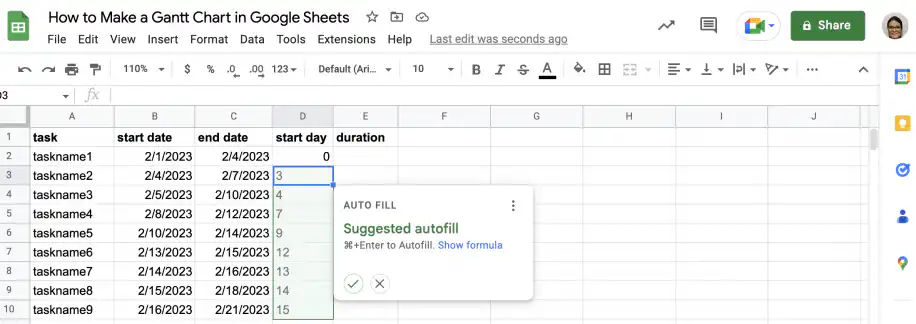
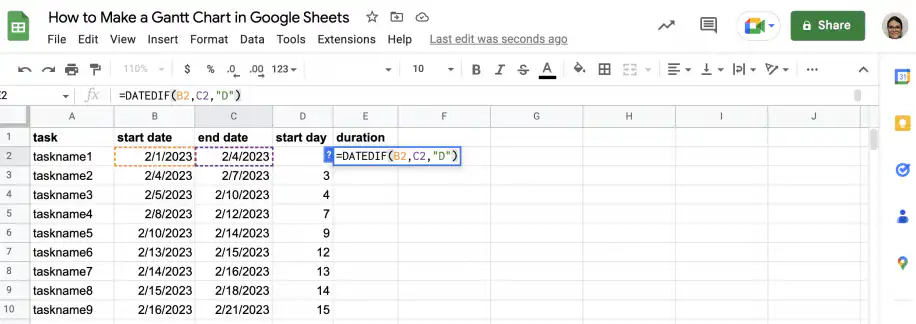
6. You can also use the DATEDIF function to find the tasks’ duration. However, make sure you don’t use absolute referencing for any of the parameters.
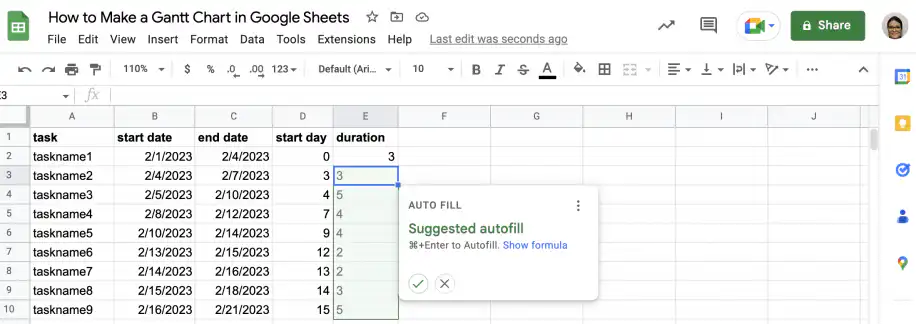
7. As before, accept the selected autofill or grab the fill handle to copy down to the last task.
Add a stacked bar chart
Now that you have all the required data, it’s time to add a stacked bar chart.
1. Select the columns with the task, the start day, and the duration.
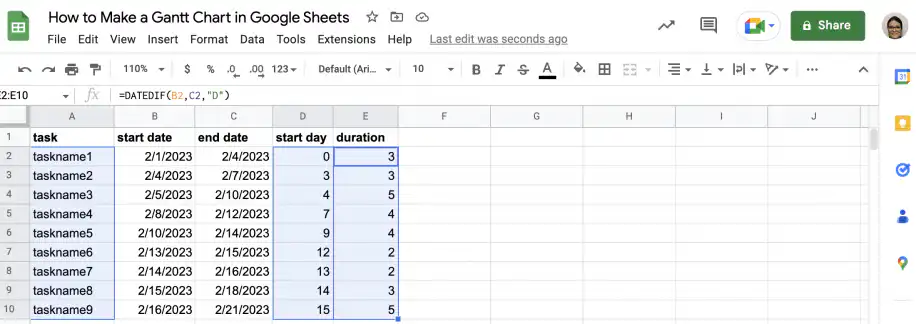
2. Go to Insert > Chart.
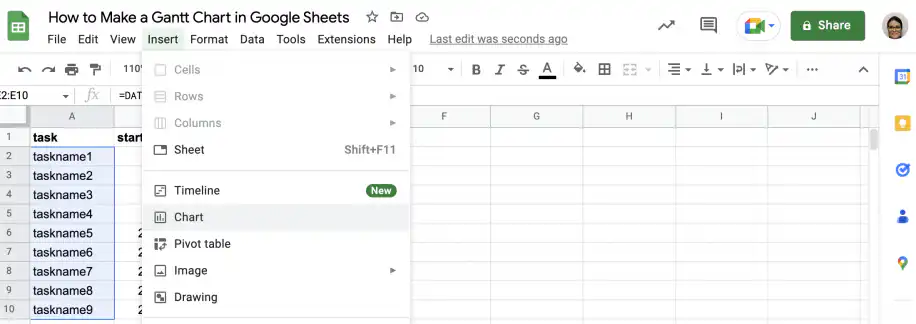
3. In the chart editor, select the stacked bar chart type.
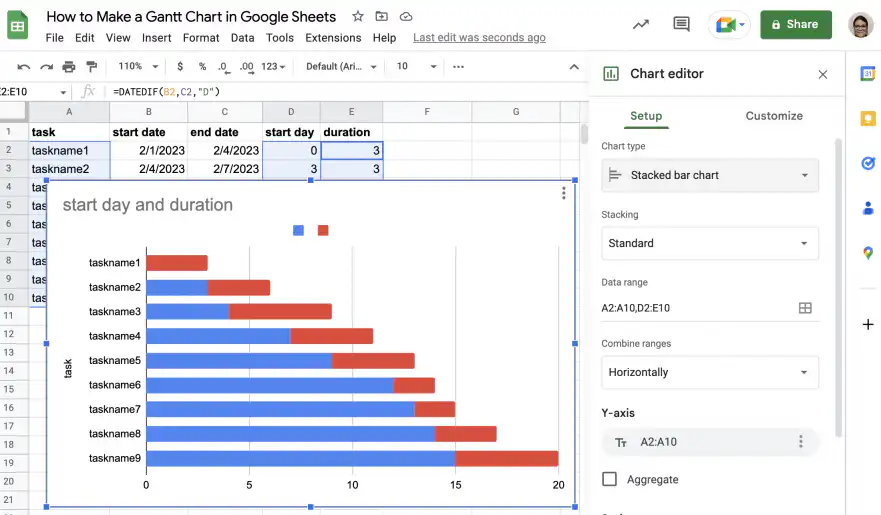
Turn the bar chart into a Gantt chart
A few modifications will convert your bar chart into a Gantt chart.
1. In the ‘Customize’ tab in the chart editor, click ‘Chart & axis titles’ to type in your preferred title.
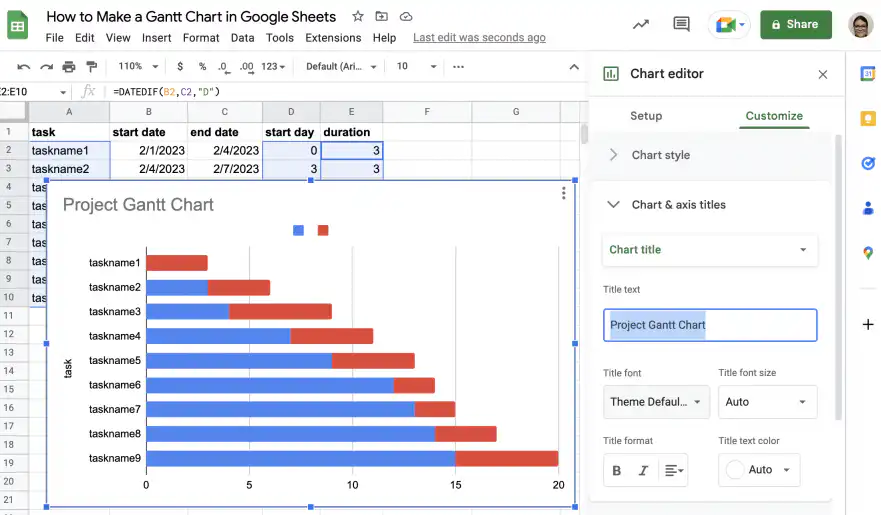
2. Go to ‘Series’ and change the color of the first series, start day.
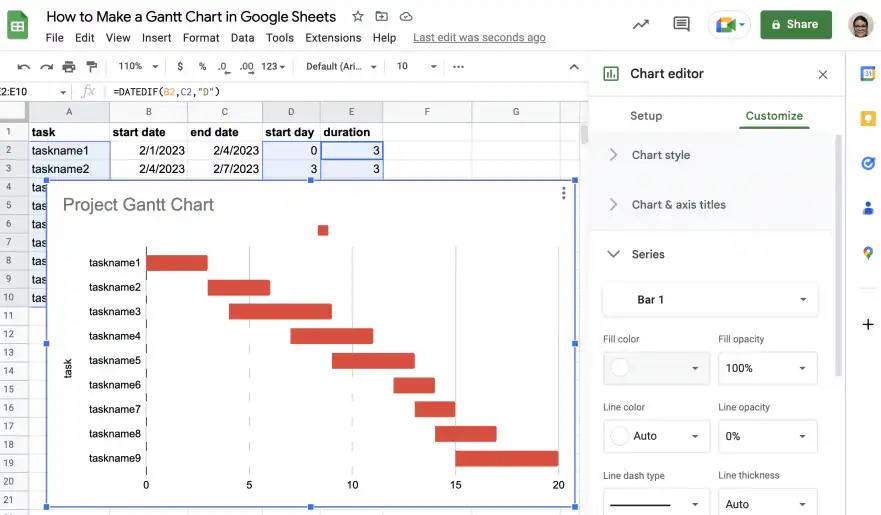
3. Next, click ‘Legend’ and select ‘None’ as shown below.
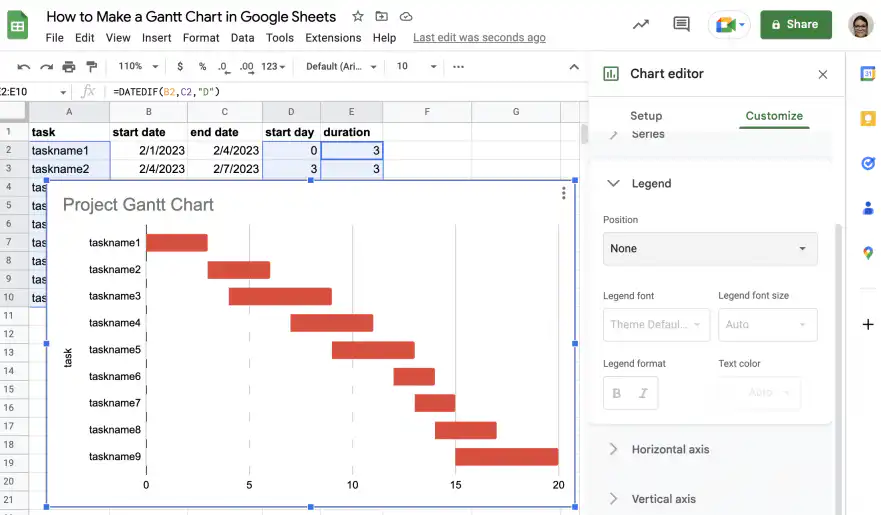
4. Select the vertical axis title and delete the text to remove it.
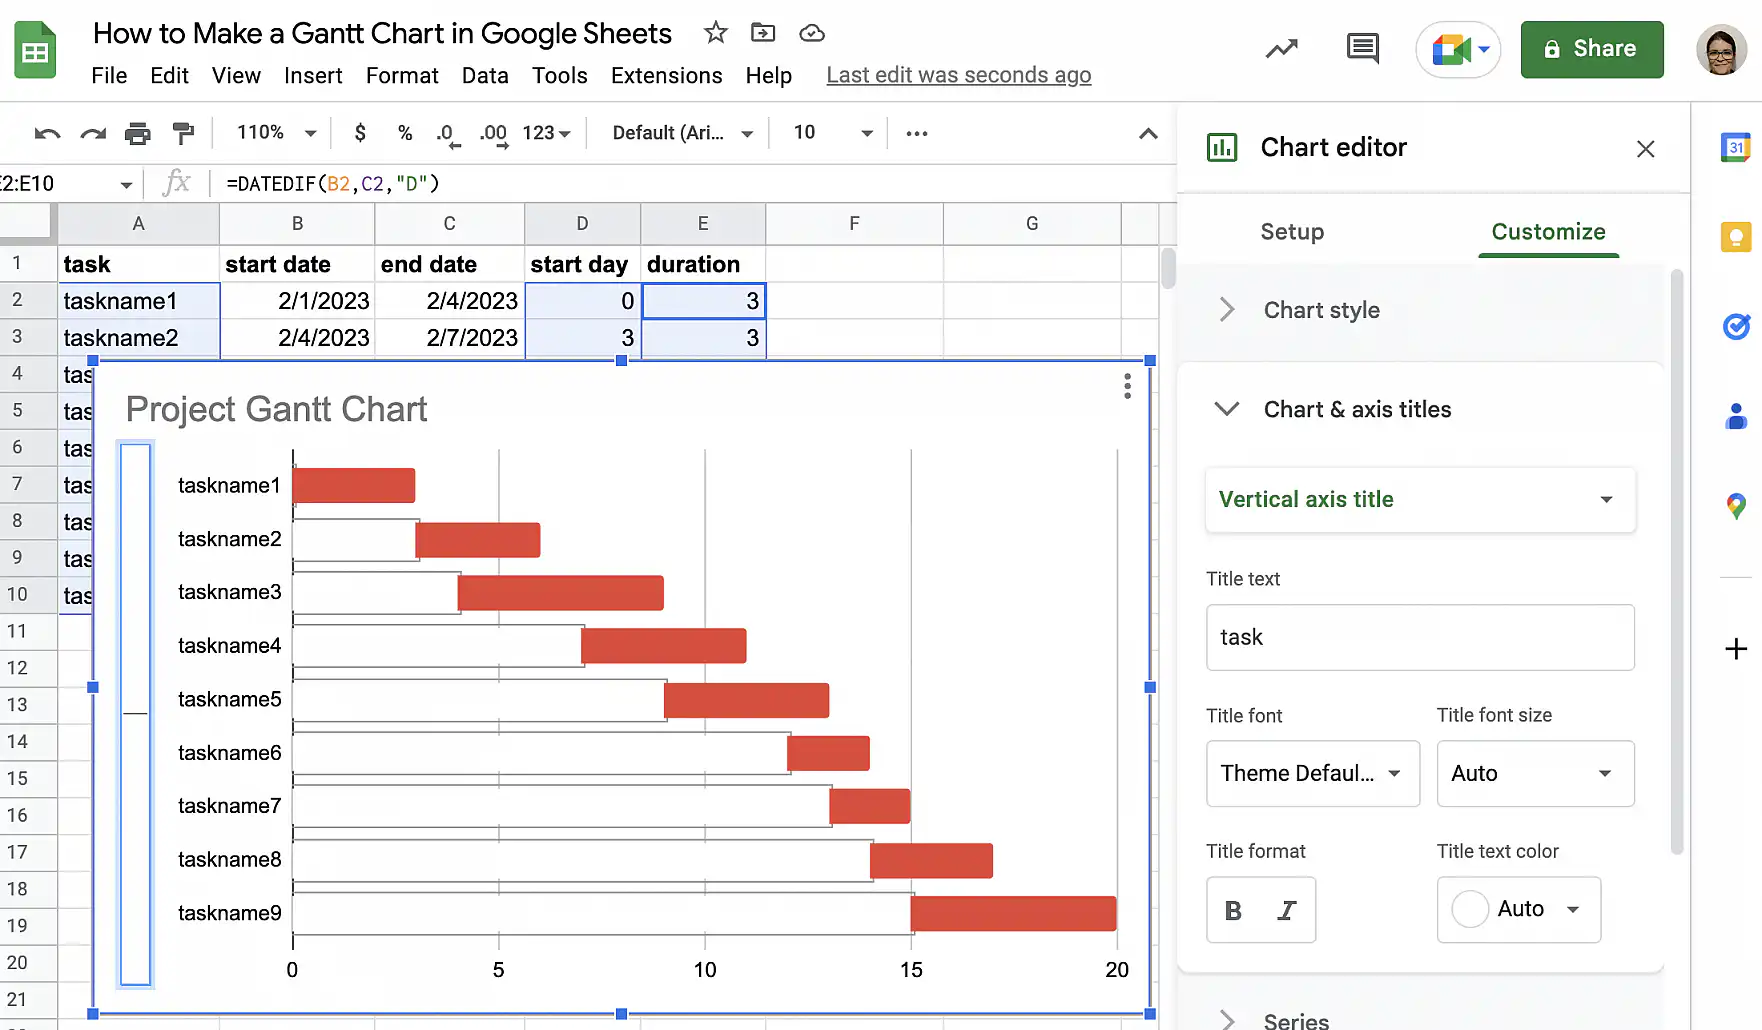
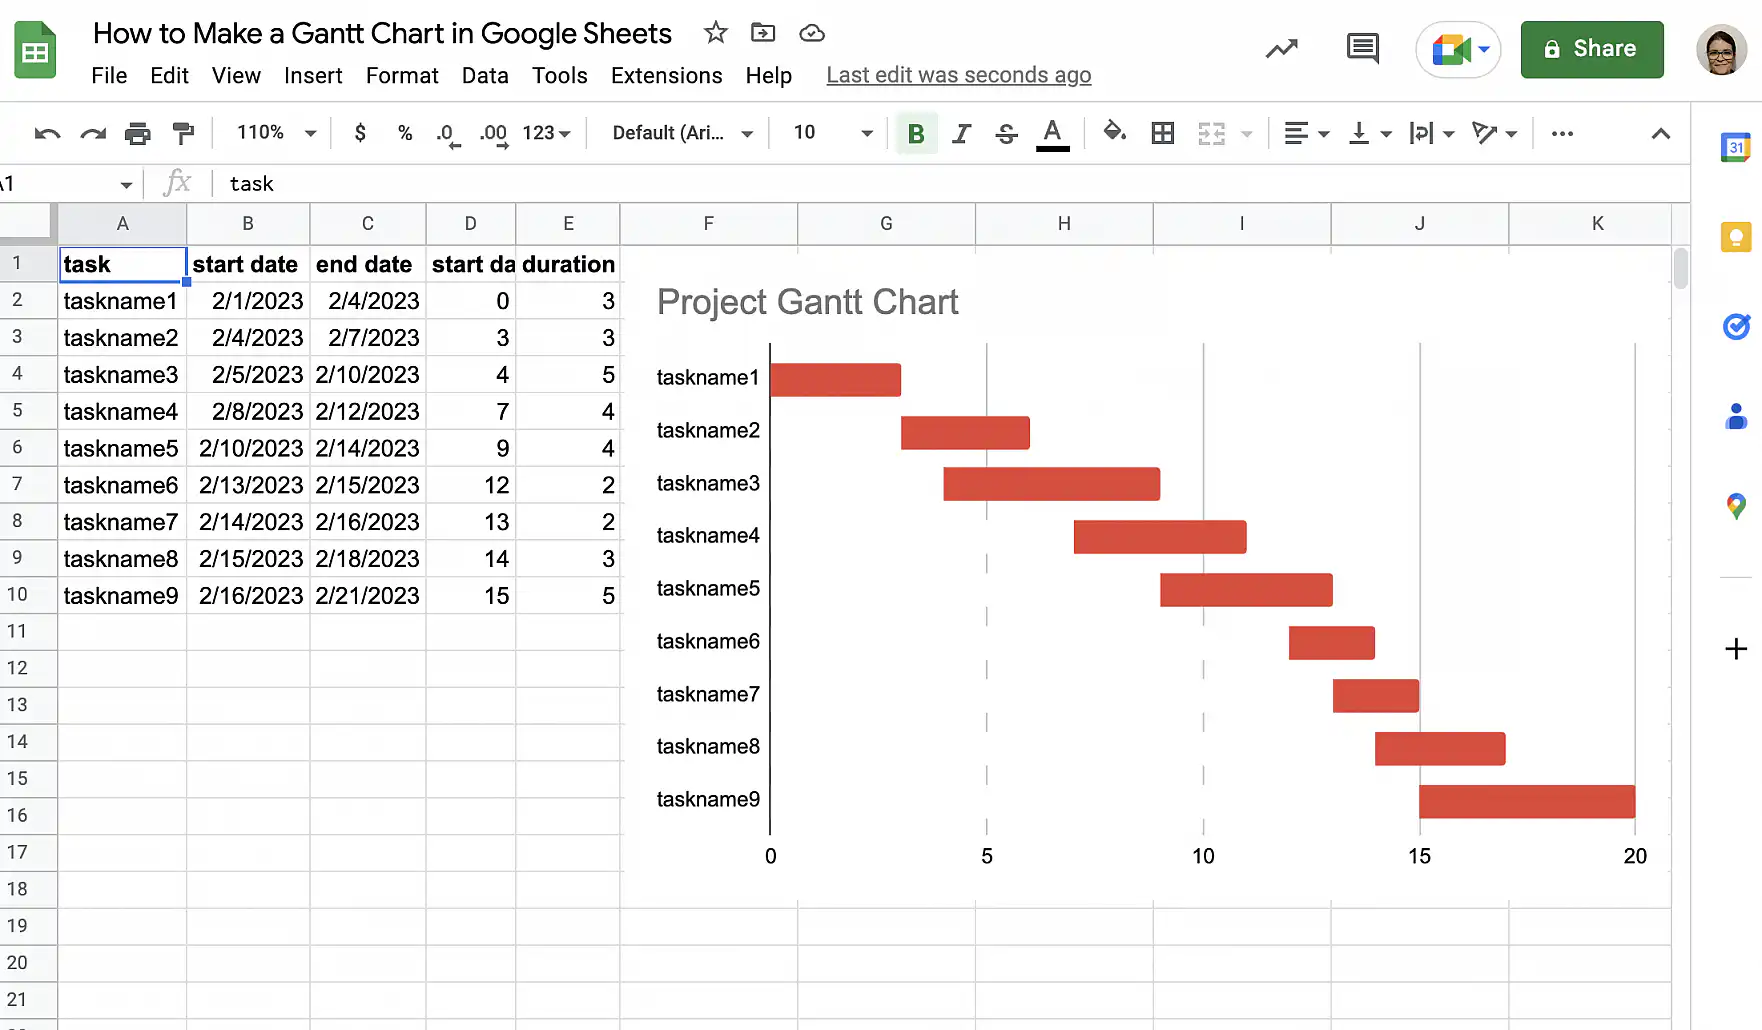
5. Your chart now looks like a traditional Gantt chart. However, you can modify it further to match your style guide.
Gantt chart with dependencies in Google Sheets
There are four different types of dependencies you can add to your Gantt chart. Follow the instructions below to add different types of dependencies to your Gantt chart.
Finish-to-start
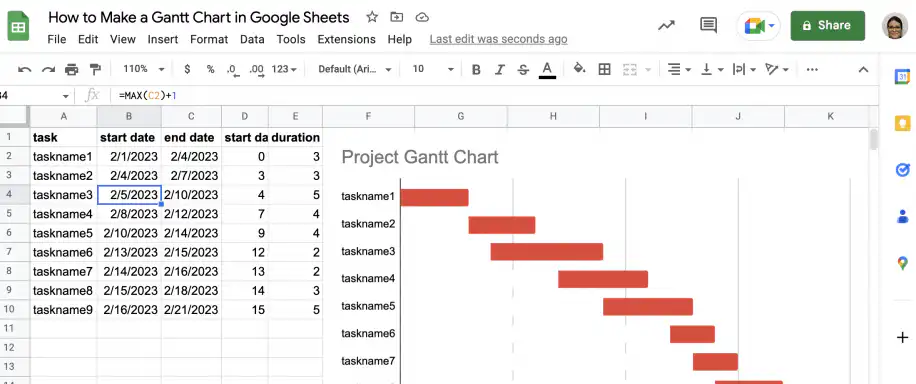
This kind of dependency refers to tasks that need to be finished for another task to start. In this example, the third task cannot begin until the first is completed.
1. In the cell corresponding to the third task’s start date, type in the MAX function and select the first task’s end date. Add 1 to ensure the task starts the next day.
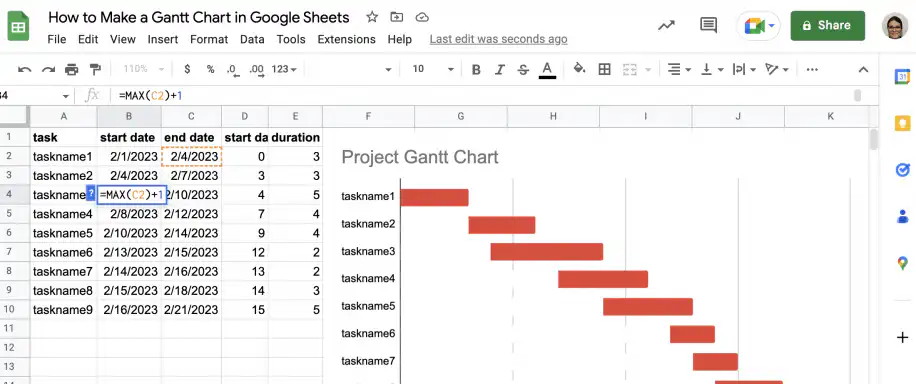
2. The third task’s start date now depends on the first task’s end date.
Start-to-finish
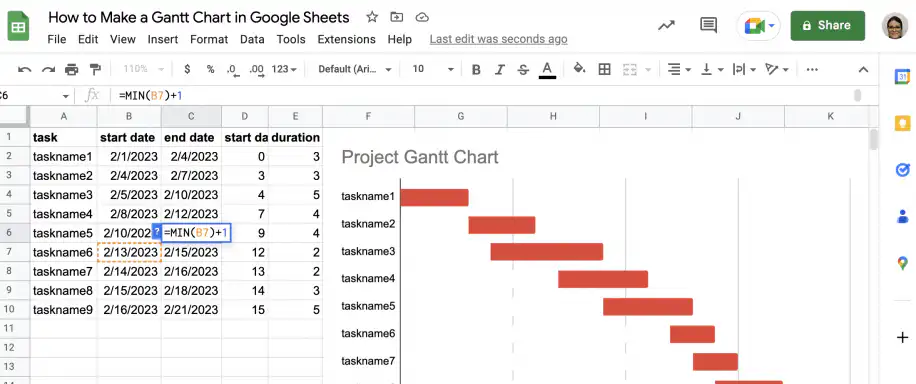
This type of dependency refers to tasks that must be started before another task can be finished. In this example, the fifth task cannot be completed until the sixth has started.
In this case, you need to use the MIN function for the fifth task’s end date, then add 1.
Start-to-start
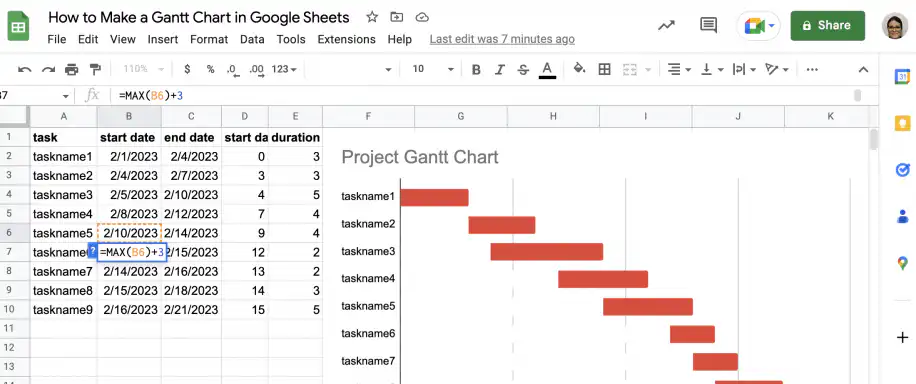
This type of dependency occurs when a task must start before another task can start. In this example, the fifth task must start before the sixth can begin.
Here, the sixth task’s start date is =MAX(B6)+3, so it starts three days after the fifth task.
Finish-to-finish
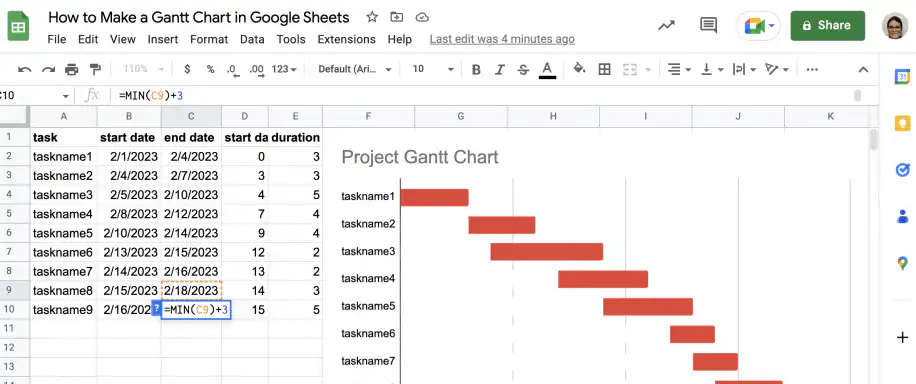
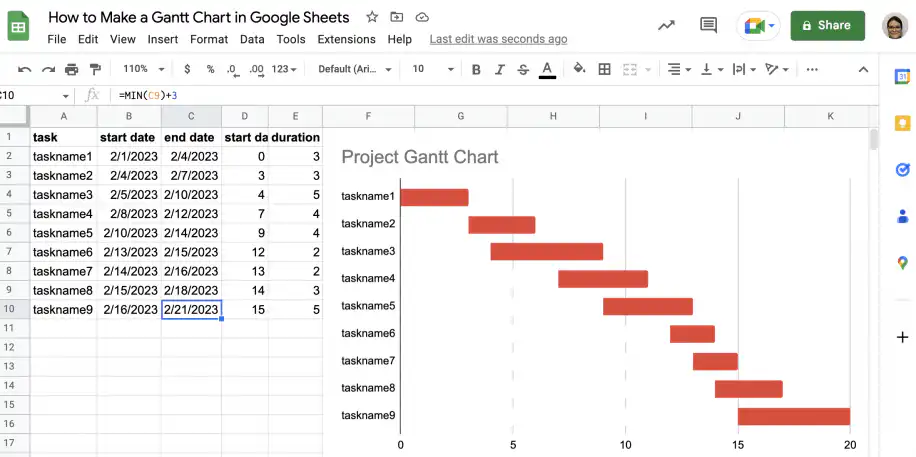
The final type of dependency requires that one task finishes before the other can finish. In this case, the eighth task must be completed before the ninth can finish.
Here, the ninth task’s end date is =MIN(C9)+3, so it ends three days after the eighth task.
That’s it. You can add as many dependencies as you need.
How to structure your project in a Gantt chart
Every project has 5 key stages or “groups”:
- Initiation/conception.
- Planning/definition.
- Execution/launch.
- Control/monitoring.
- Project close.
These groups are then divided into subgroups, and subgroups are divided into tasks. For example, your Group might be “Planning”, your subgroup might be “Communications Plan,” and your task might be “Define communication channels”.
Each task is usually allocated to an owner (the individual responsible for completing it).
Using a WBS for project management
Gantt charts and other project management tools often use a WBS. This stands for work breakdown structure. It’s a method for organizing a project in manageable, deliverable sections. A WBS has a hierarchical, tree-like structure, meaning that you break one large project down into smaller, achievable tasks. In your Gantt chart, a WBS helps you name and identify tasks (and their relation to each other) in this logical way.
For example, Planning (group) could be allocated the WBS number 2. In that case, Communications plan (your subgroup) might be 2.3 and Define communications channels (your task) might be 2.3.1.

How to add a Gantt chart to Google Docs
Google Docs has no Gantt chart type, so build the chart in Google Sheets first with the steps above. Then, in your document, go to Insert > Chart > From Sheets, pick the spreadsheet, select the Gantt chart, keep Link to spreadsheet checked, and click Import. When the dates change in your sheet, click Update on the chart in the document to refresh it. Both apps run in the browser, so you don’t need to install anything.
Looking for specialist Gantt software?
If you focus on project management in your work, you might want to invest in more advanced Gantt software such as TeamGantt or GanttPro.
These applications help you plan, manage and collaborate on projects, with an attractive interface for presentation. If you need to share Gantt charts and project visualizations with external stakeholders, it might be worth paying for this type of software.
Conclusion
Creating a Gantt chart in Google Sheets is not that scary. If you follow the steps, it’s a straightforward process. There will be dependent or concurrent tasks in almost any project, and the Gantt chart allows you to reflect that. You now know how to create a simple Gantt chart in Google Sheets, how to customize it to your needs and preferences, and how to add dependencies.
To skip the setup next time, start from the template at the top of this guide. Our post on the project management template in Google Sheets shows how to set it up, and if your team works in Excel, there’s a Gantt chart Excel template too.



 English
 Español
 Português do Brasil
 Français