Get help

Help center

Guides and answers

Contact support

Write to our team

Sign in to

Workflows

Build processes with your team

Automations

Connect files and automate tasks

One system, four parts

AI agents

Virtual Employees that work 24/7

Automations

Connect files and automate tasks

Workflows

Build processes with your team

Data Space

Trusted data sharing and control

Solutions by department

Finance

Reports, budgets, and reconciliations

Inventory and manufacturing

Stock, orders, and production in one view

HR

Timesheets, attendance, and reviews

Project management

Status and workload across projects

Sales and CRM

Leads and deals kept up to date

Education

Student records and school data

Finance

Turn manual finance work into reports that update themselves.

What Finance teams automate

  • Track payables and receivables
  • Build cash flow statements
  • Compare budget against actuals

Inventory and manufacturing

See stock levels and automate ordering.

What inventory and manufacturing teams automate

  • Track inventory across multiple sites
  • Connect sales, purchasing, and warehouse data
  • Link a barcode scanner to your sheet

HR

Run recruitment, attendance, and OKR tracking from your sheets.

What HR teams automate

  • Track recruitment and onboarding
  • Record team OKRs and results
  • Track check-ins, check-outs, and leave

Project management

Assign tasks and track hours without manual updates.

What project teams automate

  • Assign tasks and track status changes
  • Estimate effort and log hours worked
  • Track milestones across projects

Sales and CRM

Track leads and sales performance with automated reports.

What sales teams automate

  • Track and convert leads
  • Set sales goals and track team metrics
  • Monitor sales KPIs on dashboards

Education

Automate attendance, grades, and school purchasing.

What schools automate

  • Track attendance and notify parents
  • Record and compare class grades
  • Track inventory lent to students and staff

Find a use case

By department

How each team uses Sheetgo

By industry

How each industry uses Sheetgo

By company size

Small, medium-sized, or large

Learn

Blog

Guides and product news

Customer stories

How teams like yours use Sheetgo

Help center

Guides and answers

Why Sheetgo

Compare

How Sheetgo compares with other tools

Security

How we protect your data

Trust center

Our compliance details

Sign in to

Workflows

Build processes with your team

Automations

Connect files and automate tasks

One system, four parts

AI agents

Virtual Employees that work 24/7

Automations

Connect files and automate tasks

Workflows

Build processes with your team

Data Space

Trusted data sharing and control

Solutions by department

Finance

Reports, budgets, and reconciliations

Inventory and manufacturing

Stock, orders, and production in one view

HR

Timesheets, attendance, and reviews

Project management

Status and workload across projects

Sales and CRM

Leads and deals kept up to date

Education

Student records and school data

Find a use case

By department

How each team uses Sheetgo

By industry

How each industry uses Sheetgo

By company size

Small, medium-sized, or large

Get started

Templates

Ready-made workflows to start from

Learn

Blog

Guides and product news

Customer stories

How teams like yours use Sheetgo

Help center

Guides and answers

Why Sheetgo

Compare

How Sheetgo compares with other tools

Security

How we protect your data

Trust center

Our compliance details

Help center

Guides and answers

Contact support

Write to our team

Workflows

Build processes with your team

Automations

Connect files and automate tasks

Funnel charts explained (complete guide)

When you want to illustrate your sales funnel data, what could be better than a funnel chart? In fact, you can use them to illustrate any multi-stage process where the numbers decrease with each stage. In addition to the sales funnel, these charts are often used to represent the recruitment funnel, order fulfillment, and website traffic engagement.

In this guide, you will learn what a funnel chart is and what it’s used for, as well as how to create one in Google Sheets. While Microsoft Excel has a built-in funnel chart type, you’ll need a few extra steps if you want one in Google Sheets. Fortunately, they’re very easy steps. You have detailed instructions on how to set up the data and customize the standard stacked bar chart into a funnel chart. You also have examples showing how to create a sales funnel chart and a recruitment funnel chart.

What is a funnel chart?

Funnel charts provide a high-level view of a multi-stage process, where the measured value decreases with each stage. Each stage is represented by a bar, starting with the initial total value at the top. Each bar is smaller than the previous one, making the chart look like a funnel.

While the length or width of these horizontal bars changes according to the value, their height is equal. The values used are usually the totals for each stage, so the ‘steps’ between stages are quite large. If you have very detailed data for each stage, you can create a funnel chart that uses trapezoids instead of bars so that the bottom of a stage matches the top of the next stage. However, be careful how you divide the stages and substages, as you may get a distorted view of your data.

What is a funnel chart used for?

The funnel chart type best illustrates multi-stage processes where values decrease with each stage. Ideally, these processes should have more than three stages; otherwise, a pie or bar chart is more suitable. For example, funnel charts are an excellent way to illustrate the sales funnel or recruitment funnel stages.

How to create a funnel chart in Google Sheets?

Since Google Sheets does not offer a built-in option for funnel charts, you will need to make some adjustments to a standard stacked bar chart. This will require creating a helper column with data, which you will later hide on the chart itself. Follow the steps below to set up your data, insert the stacked bar chart, and finally, customize it to look like a funnel chart.

1. Set up the data

First, you must set up your data and add a helper column.

1. Open Google Sheets and list your stages and the corresponding values.
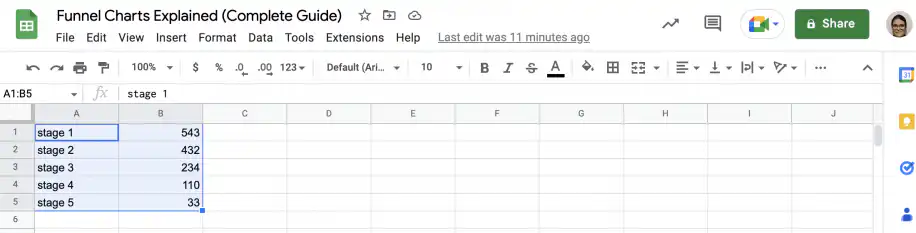
Funnel chart Google Sheets — five stages listed in column A with their values in column B

2. Insert a helper column to the left of the column with the values.
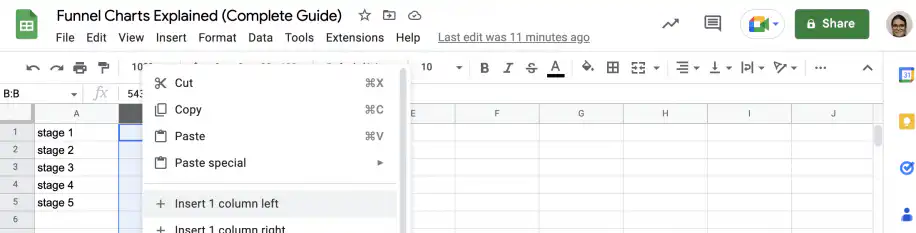
Funnel chart Google Sheets — right-click menu on column B with Insert 1 column left

3. Type an equals sign and an opening parenthesis, then select the highest value using absolute referencing. You could also use the MAX function, but if the data is appropriate for a funnel chart, the highest value should be the first.
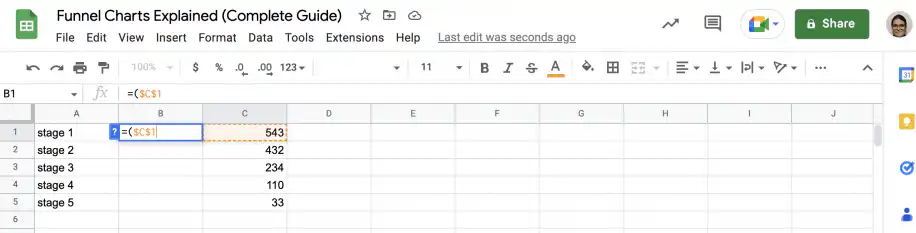
Funnel chart Google Sheets — helper column formula starting with =($C$1

4. Add a minus sign and select the value for stage one (in this case, it’s the highest value), but using relative instead of absolute referencing. Close the parenthesis.
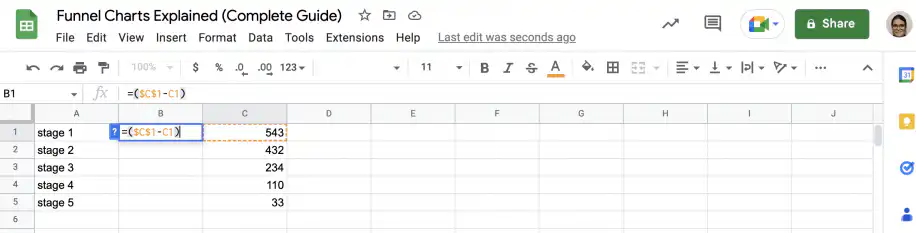
Funnel chart Google Sheets — formula =($C$1-C1) in the helper column

5. Divide the result by two and press ‘Enter’.
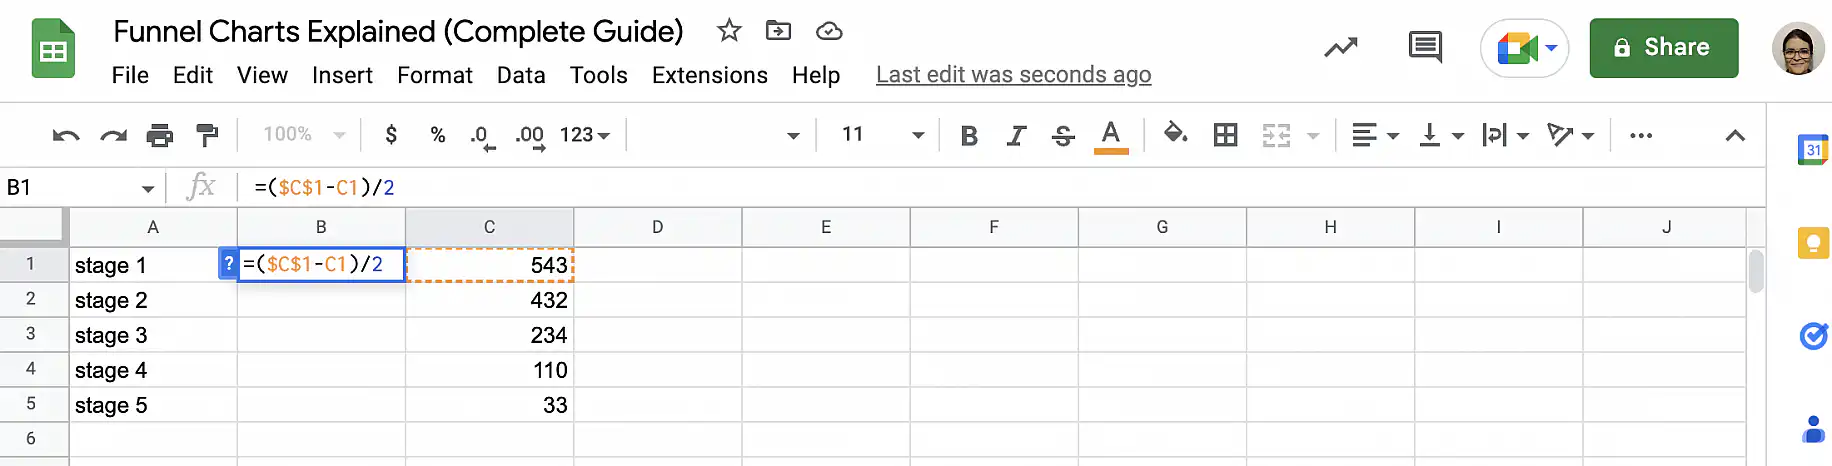
Funnel chart Google Sheets — formula =($C$1-C1)/2 in cell B1

6. Grab the fill handle and drag it down to the last stage.
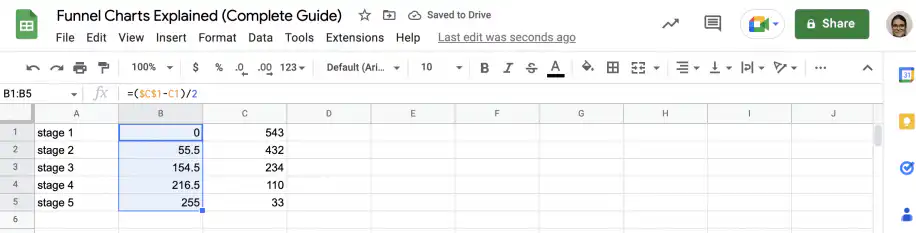
Funnel chart Google Sheets — helper formula filled down to B5 with values 0 to 255

2. Insert bar chart

Since Google Sheets has no built-in funnel chart type, you’ll need to build on a standard stacked bar chart.

1. Select all three columns and go to Insert > Chart.
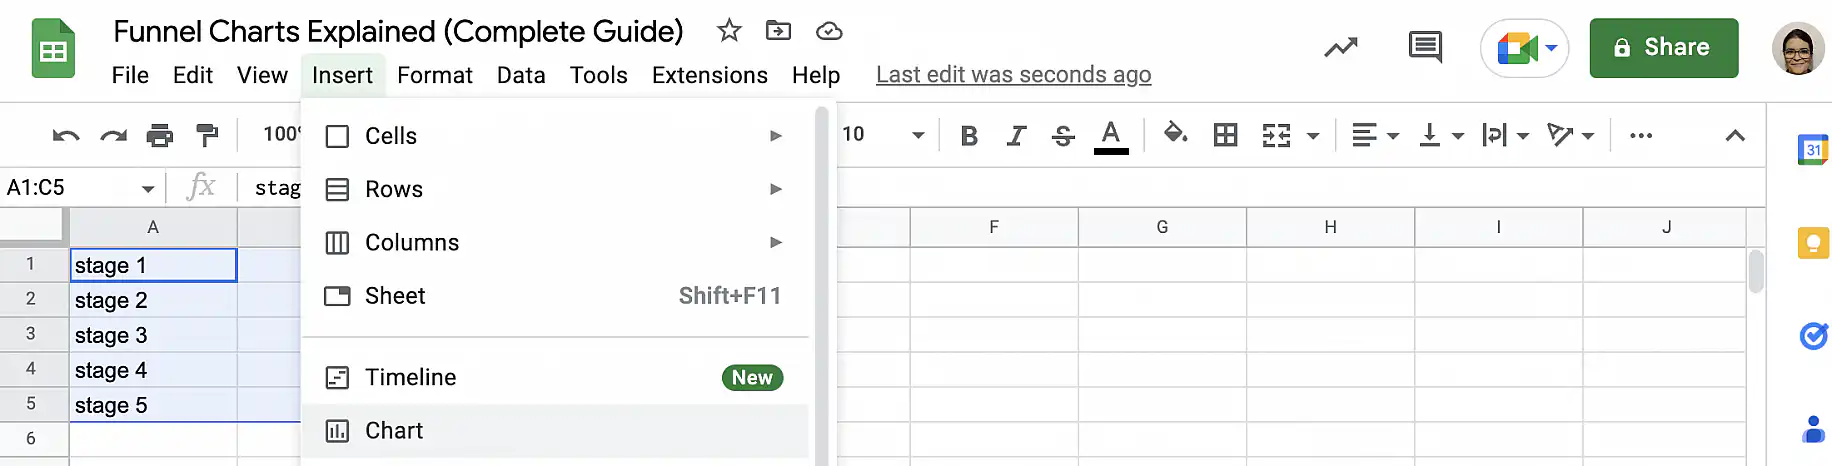
Funnel chart Google Sheets — data selected and Insert menu open with Chart

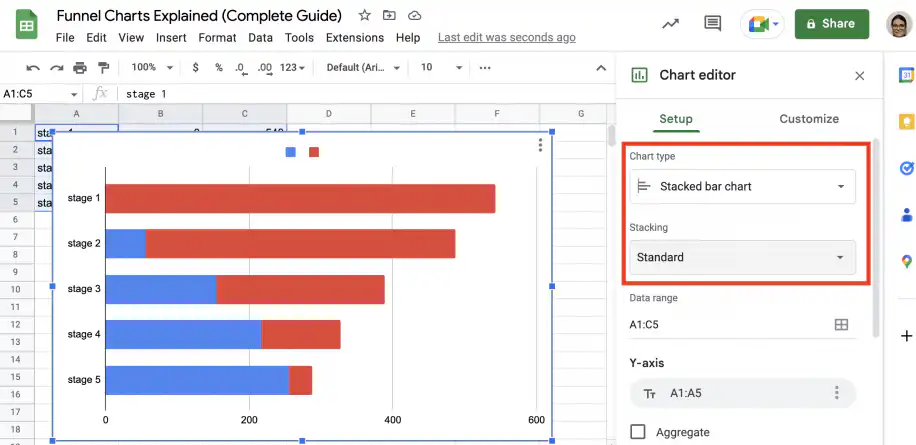
2. In the ‘Chart editor’, check that the chart type is ‘Stacked bar chart’ with ‘Standard’ stacking.
Funnel chart Google Sheets — Chart editor set to Stacked bar chart with Standard stacking

3. Customize funnel chart

As mentioned, you’ll need to make some adjustments to your chart to turn it into a funnel chart.

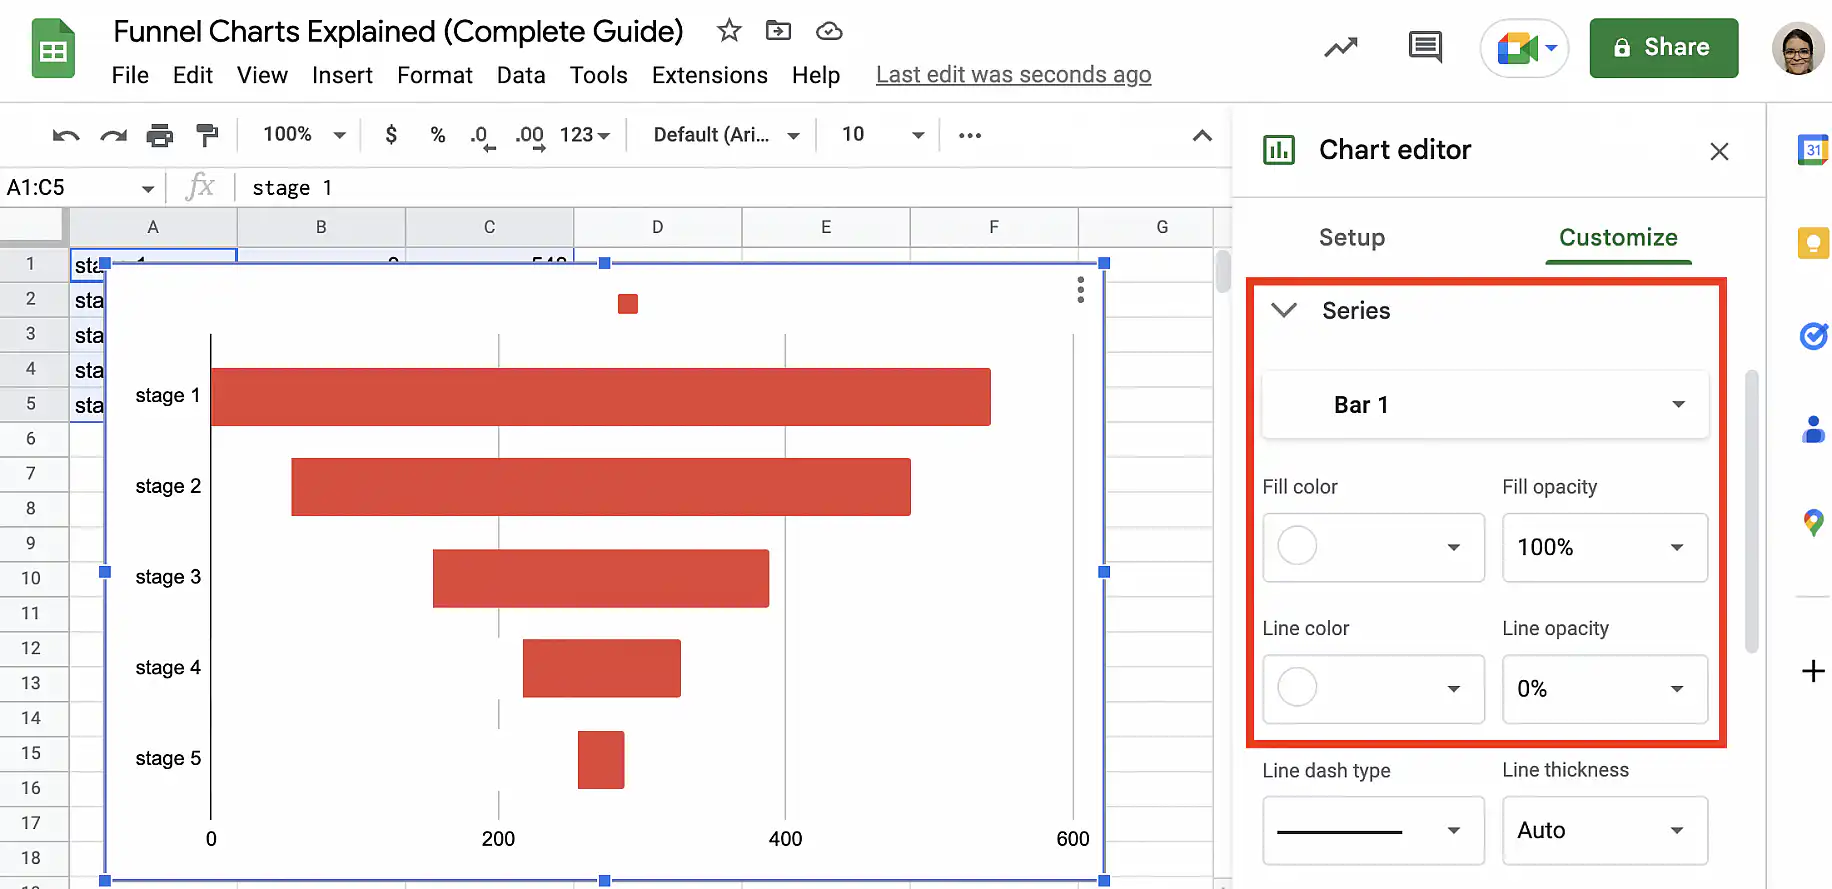
1. Under ‘Customize’ in the ‘Chart editor’, go to ‘Series’ and select the data from the helper column: ‘Bar 1’. Change the bar’s color to match the background color; in this case, I have chosen white.
Funnel chart Google Sheets — Series Bar 1 fill color set to white, leaving a funnel of red bars

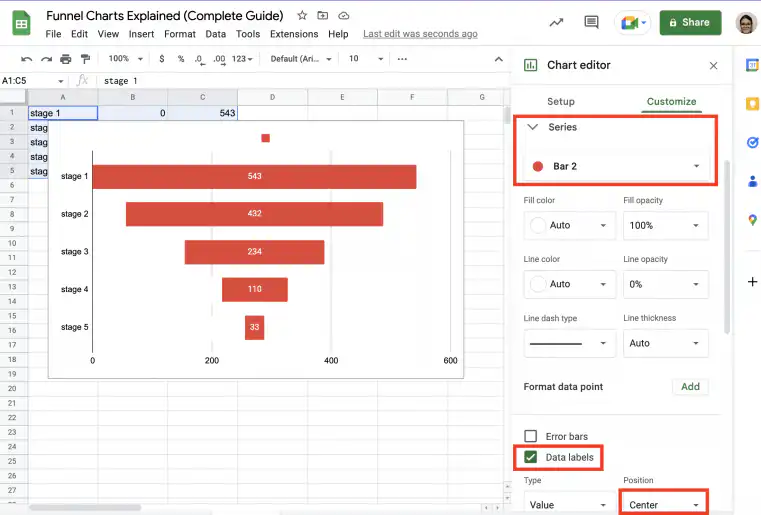
2. Select ‘Bar 2’ from the drop-down list and check the box that says ‘Data labels’. Under ‘Position’, select ‘Center’.
Funnel chart Google Sheets — Bar 2 series with Data labels checked and Center position

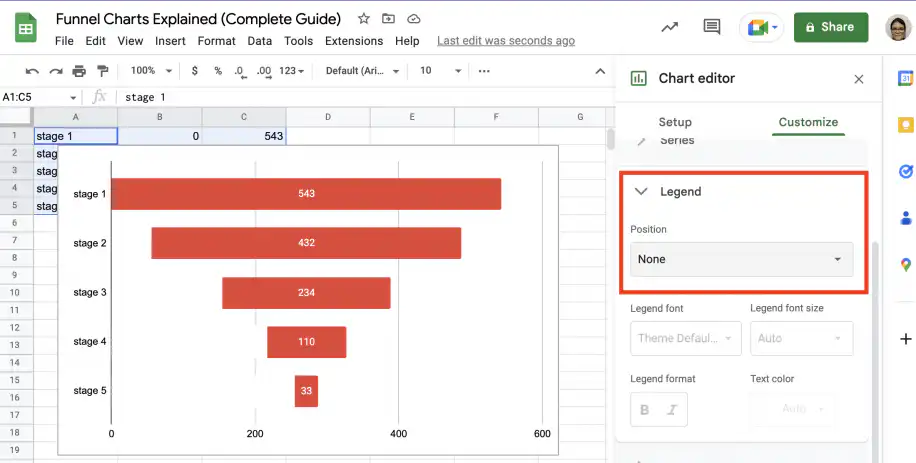
3. Click on ‘Legend’ to expand the options and select ‘None’ under ‘Position’.
Funnel chart Google Sheets — Legend position set to None in the Chart editor

4. Under ‘Gridlines and ticks’, uncheck the box that says ‘Major gridlines’.
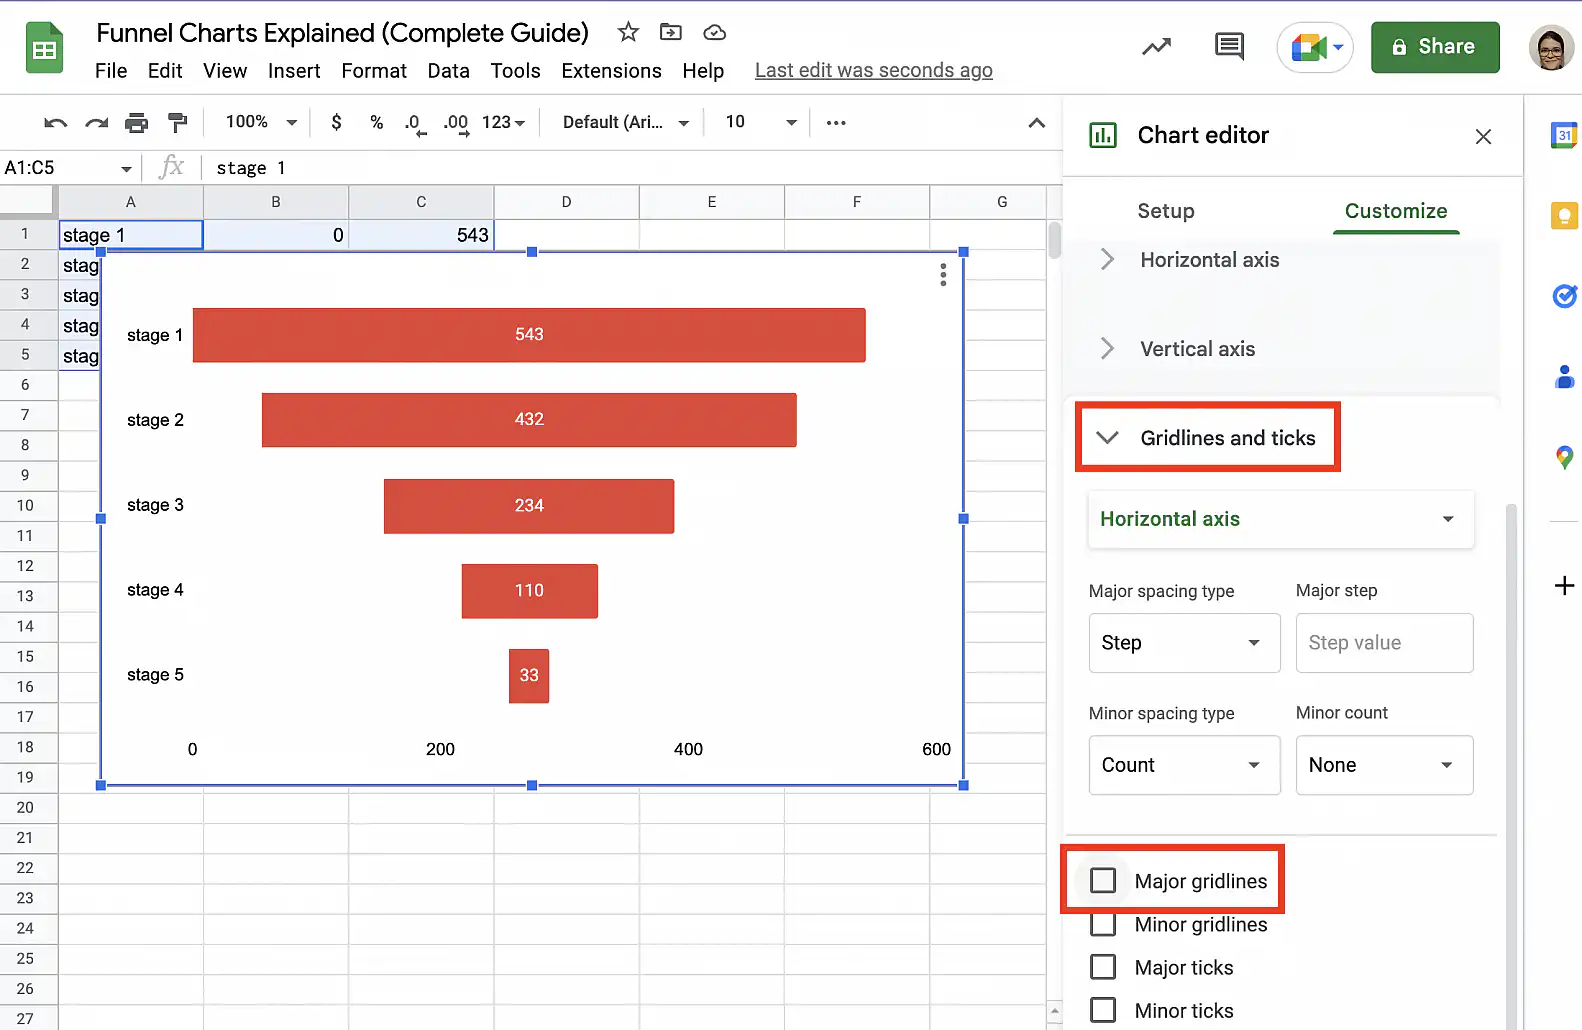
Funnel chart Google Sheets — Gridlines and ticks with Major gridlines unchecked

5. To hide the horizontal axis, change the ‘Text color’ to match the background color.
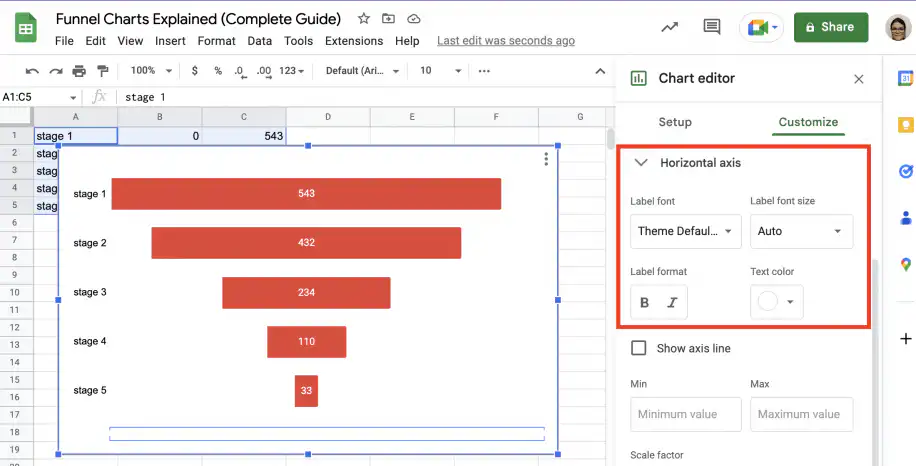
Funnel chart Google Sheets — Horizontal axis text color set to white

6. Finally, you can add a title for your chart under ‘Chart & axis titles’.
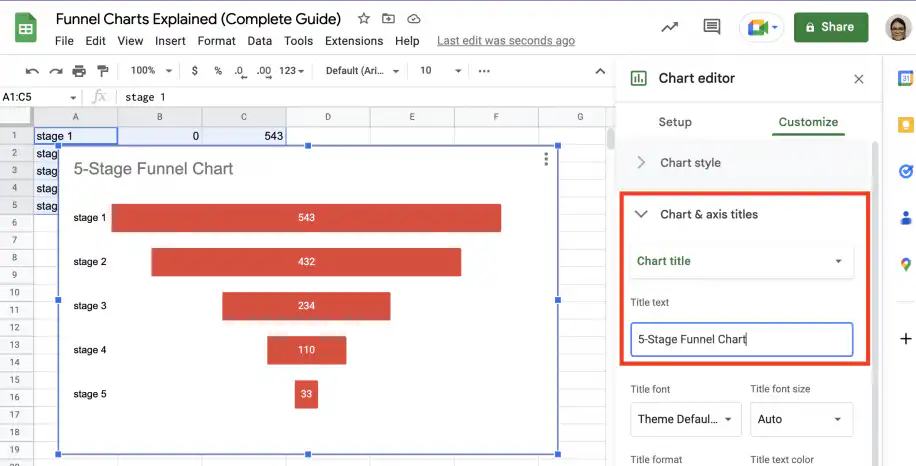
Funnel chart Google Sheets — chart title 5-Stage Funnel Chart typed in Chart & axis titles

Funnel chart examples

Below are two typical examples of funnel charts and the type of data with which you can use them: the sales funnel and the recruitment funnel.

Sales funnel

Follow the steps below to create a funnel chart based on your sales conversion data.

1. Set up your data and add the helper column, as shown in the previous section.
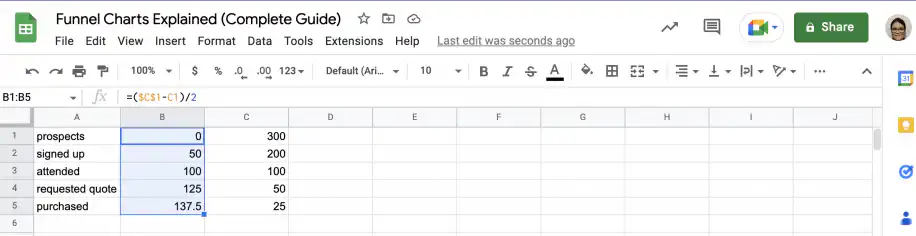
Funnel chart Google Sheets — sales stages from prospects to purchased with a helper column

2. Select the data and go to Insert > Chart.
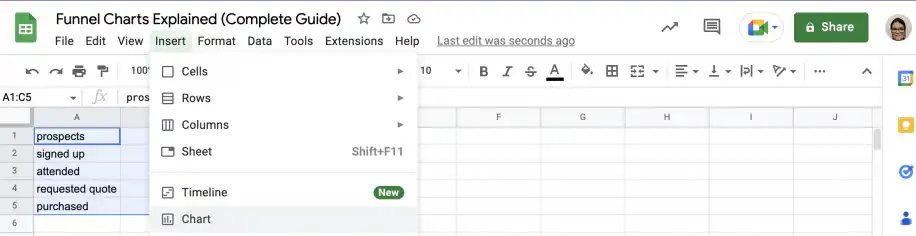
Funnel chart Google Sheets — sales data selected and Insert menu open with Chart

3. Ensure that the standard ‘Stacked bar chart’ is selected.
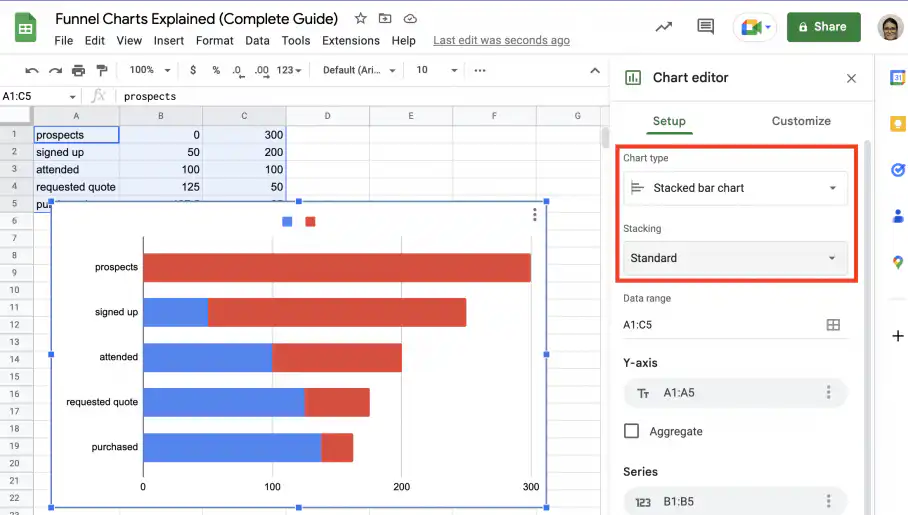
Funnel chart Google Sheets — sales data as a standard stacked bar chart in the Chart editor

4. Follow the instructions in the previous section to customize the chart and turn it into a funnel chart.
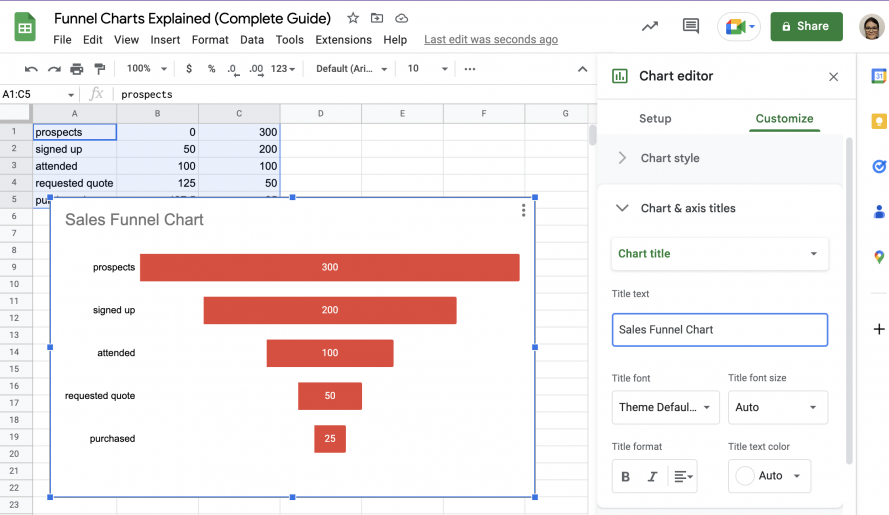
Funnel chart Google Sheets — finished Sales Funnel Chart from 300 prospects to 25 purchases

Recruitment funnel

Follow the steps below to create a funnel chart based on your recruitment process data.

1. Add the helper column to your recruitment funnel data, as shown in an earlier section.
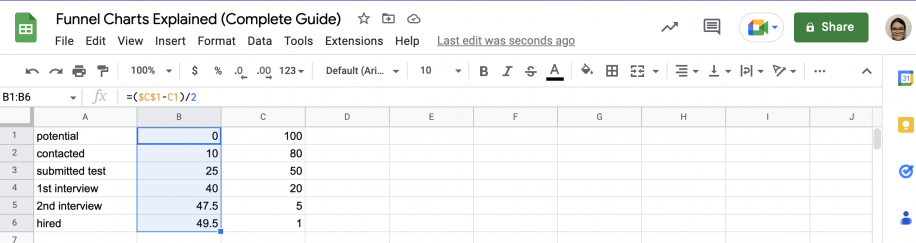
Funnel chart Google Sheets — recruitment stages from potential to hired with a helper column

2. Select the three columns of data and go to Insert > Chart.
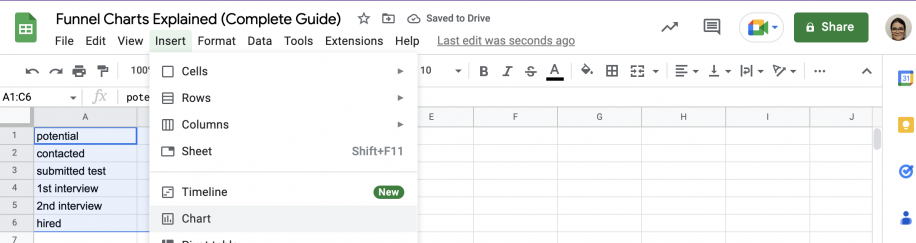
Funnel chart Google Sheets — recruitment data selected and Insert menu open with Chart

3. Select the ‘Stacked bar chart’ and choose ‘Standard’ stacking.
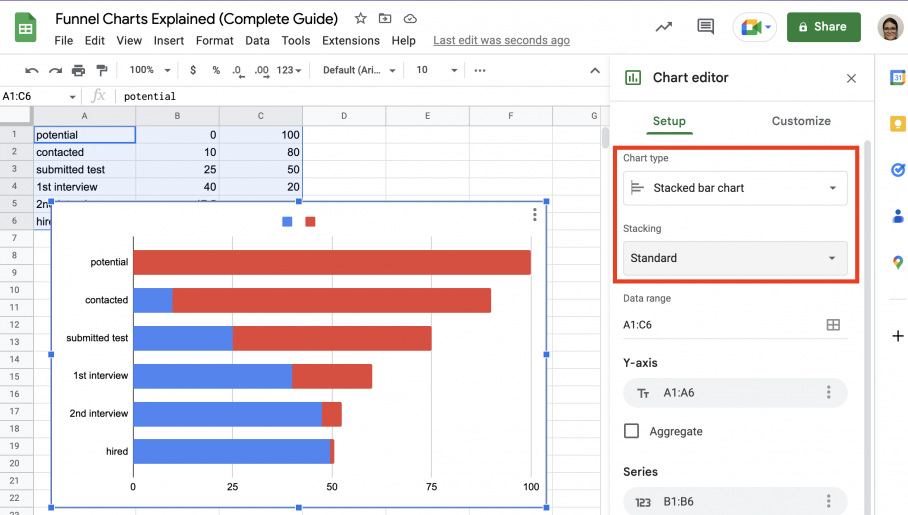
Funnel chart Google Sheets — recruitment data as a standard stacked bar chart

4. Customize your recruitment funnel chart, as shown in an earlier section.
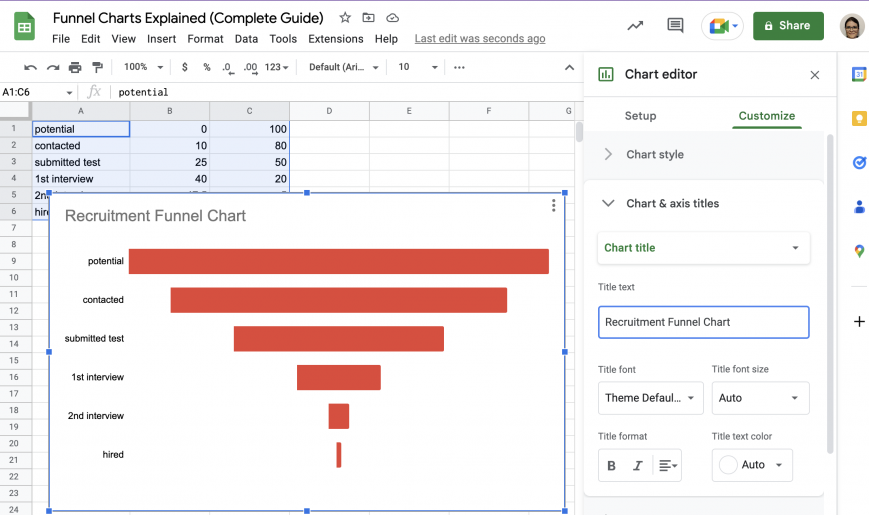
Funnel chart Google Sheets — finished Recruitment Funnel Chart from potential candidates to hired

Conclusion

Funnel charts provide a simple but effective illustration of how values decrease as a multi-stage process advances. You can use them to show your sales conversion data, your order fulfillment data, or your recruitment data. The more detailed and structured your data is, the more clearly you can identify potential bottlenecks in your processes. If your funnel numbers live in several spreadsheets, Sheetgo, an AI-powered data automation platform, can bring them into one sheet so your funnel chart stays up to date.

You now know what a funnel chart is and what types of data it’s usually used to illustrate. You also know that, unlike Microsoft Excel, Google Sheets doesn’t have a built-in funnel chart type, but you have step-by-step instructions on how to set up the data and add a helper column, insert a stacked bar chart, and customize it to turn it into a funnel chart.

Check out the guides below to learn more about creating different types of charts and graphs in Google Sheets.

You may also like…

google sheets features and formulas

Top 5 dynamic array formulas in Google Sheets 

Google Sheets has evolved beyond basic spreadsheets. With the introduction of dynamic array formulas, users can now manipulate and analyze...
google sheets features and formulas

Mastering the FILTER Formula: 4 Use Cases with Examples

The FILTER formula in Google Sheets is a versatile tool for extracting data that meets specific conditions. Unlike the QUERY formula,...
google sheets features and formulas

Unlocking the Power of SUMIF and SUMIFS in Google Sheets: 4 real-life use cases

The SUMIF and SUMIFS formulas in Google Sheets are indispensable tools for performing conditional summations. They simplify complex...