




Let’s say you’ve introduced new products or services to your business that have started doing very well. Not only do your revenue figures increase every month, but the “increase” itself is also growing. If you want to predict your future expenses, looking at the figures for previous years, you might notice that they’ve started growing exponentially as well.
Whichever the case, you can use Excel’s GROWTH function to obtain an estimate for the next month or year. If your figures show linear growth, you should use the TREND function instead.
In this article, you will learn what the GROWTH function in Excel is and how to use it to predict future values based on existing ones. In addition to the known values for the dependent variable, you can also include values for one or more independent variables.
What is Excel’s GROWTH function?
The GROWTH function predicts future values based on the assumption of exponential growth.
To calculate this, the Excel GROWTH function requires values you already have for the dependent variable (known_y’s).
As for the optional values, these include those corresponding to the independent variable which you may or may not have (known_x’s), and those for which you’d like to find new values (new_x’s). The last is a logical value to determine the constant (const).
If your values show linear growth, you can use the TREND function to estimate future values. The same straight-line idea is behind linear regression in Google Sheets.
GROWTH function syntax
The syntax for Excel’s GROWTH function is shown below:
=GROWTH(known_y's, [known_x's], [new_x's], [const])
- known_y’s (required): These are the values you already have for the dependent variable. If any of the values in this array is 0 or negative, you will get the “#NUM!” value error.
- known_x’s (optional): An optional set of values for the independent variable, which you may already have. If you don’t, you can omit this parameter.
- new_x’s (optional): The new values of the independent variable (x), for which you want to find the values of the dependent variable (y). If this parameter is omitted, it is assumed to be the same as the known_x’s. If both known_x’s and new_x’s are omitted, they are assumed to be the array {1,2,3,…}.
- const (optional): A logical value that determines whether or not the constant (b) will be calculated:
- If TRUE or omitted, b will be calculated.
- If FALSE, b will be equal to 1. The formula is then adjusted to y = m^x.
To learn more about using this function with multiple variables in the form of complex arrays and vectors, visit Microsoft’s support page on this function.
How to use Excel’s GROWTH function?
The GROWTH function can return a value or an array of values. This is how you can use the GROWTH function in your worksheet to predict a single value and to predict an array of values.
Use GROWTH to predict a value
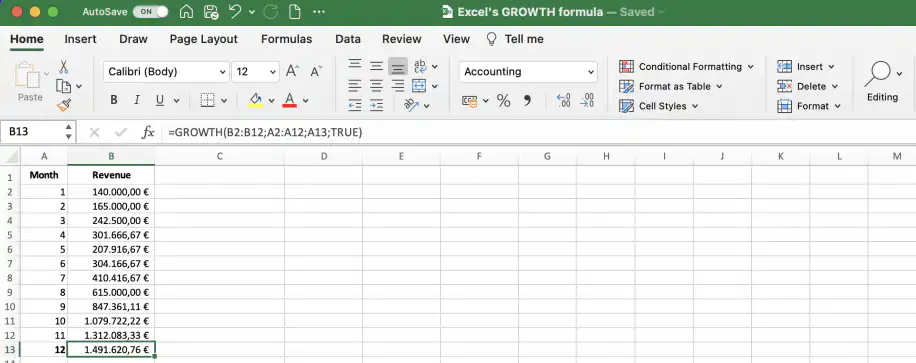
In the spreadsheet shown below, we have the values for monthly revenue for the last eleven months. I will use the GROWTH function to estimate the expected revenue for the next month, assuming exponential growth.
One column contains the values for the monthly revenue, known_y’s, and a second column contains the values for the month number known_x’s.
1. Click on the cell where you want the predicted value for revenue to appear. Here, B13.
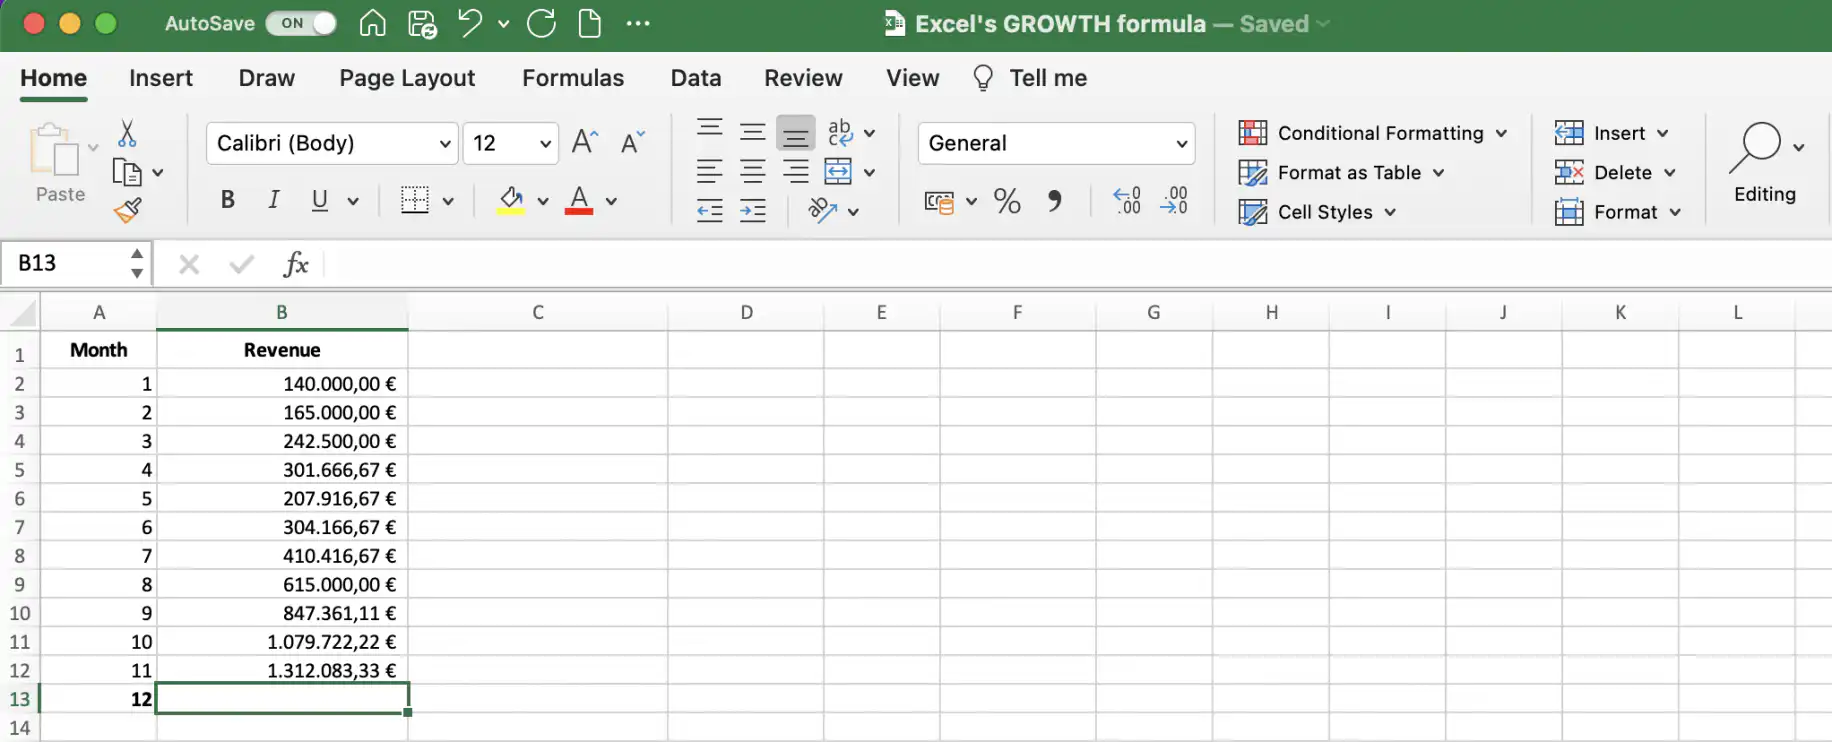
2. Type in the formula (see GROWTH function syntax above) and select the known_y’s, that is all cells containing the revenue values. Then, add a semicolon to trigger the next argument. Here, “B2:B12;”. The screenshots use semicolons to separate arguments. If your version of Excel uses commas, type a comma wherever these steps say semicolon.
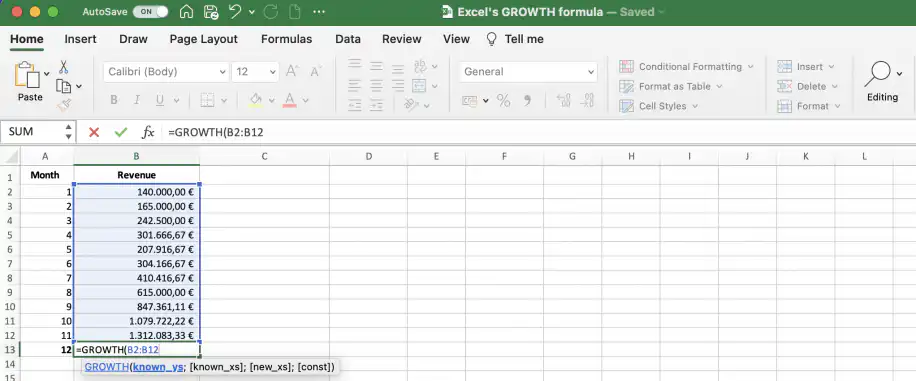
3. After the semicolon, include the range for known_x’s and add a semicolon before entering the next argument.
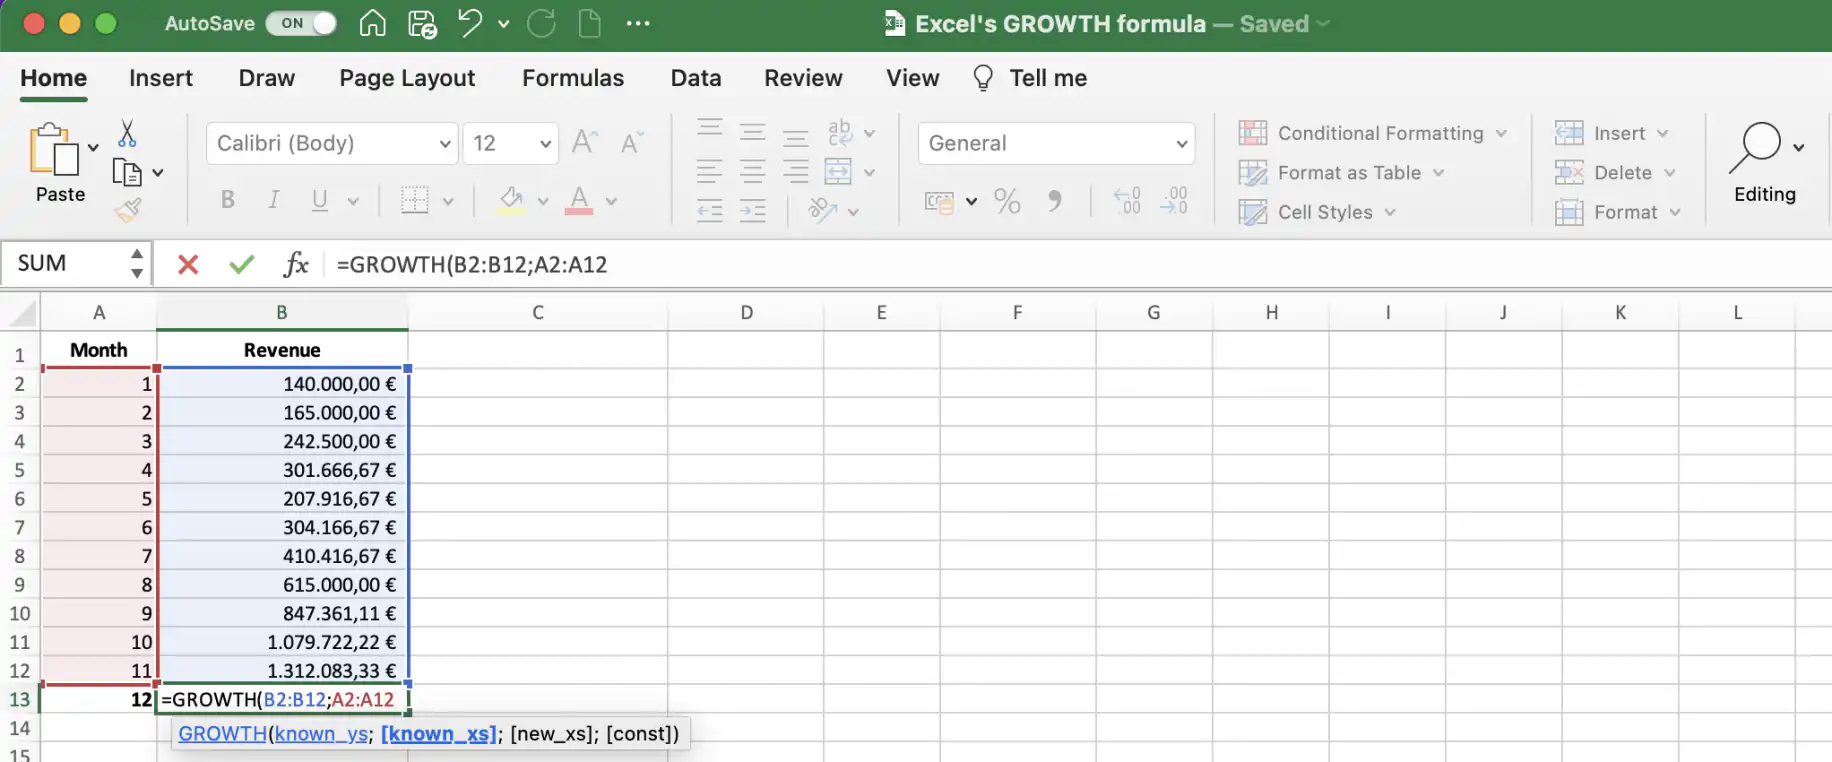
4. Select the cell with the new_x’s (here, “A13”) and add a semicolon to trigger the options for the const argument.
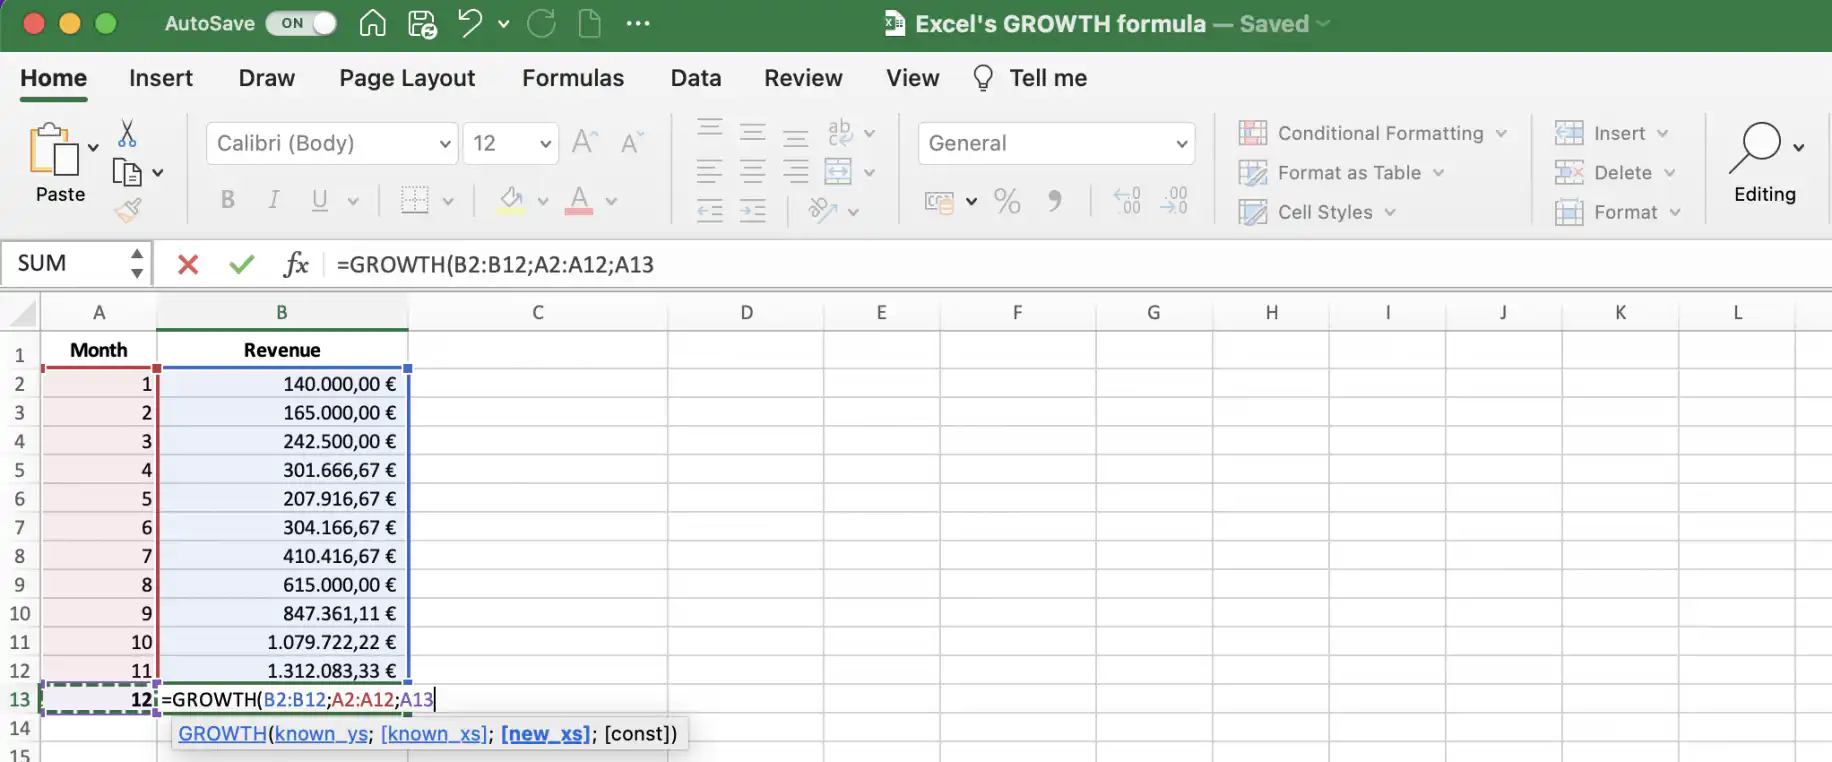
5. The values for const are “FALSE – b is set equal to 1” or “TRUE – b is calculated normally”. If you choose “TRUE” or leave it empty, the value for “b” is calculated. If you choose “FALSE”, it will be set equal to 1.
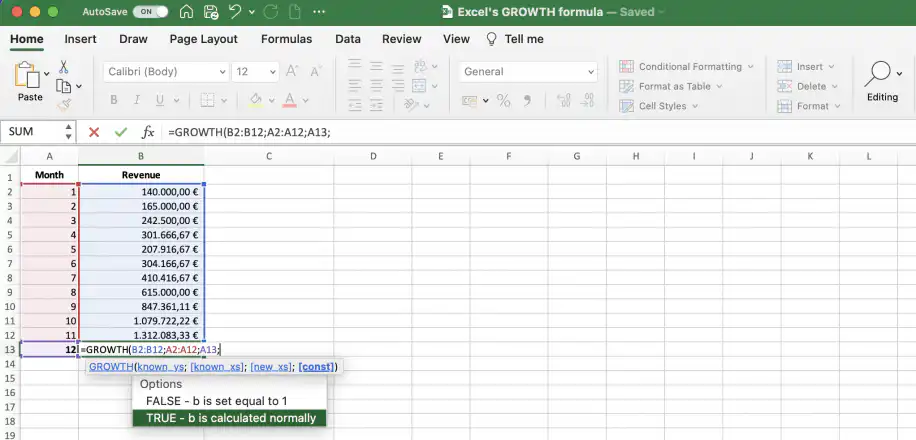
6. Finish the formula by adding the closing parenthesis and press “Enter”.
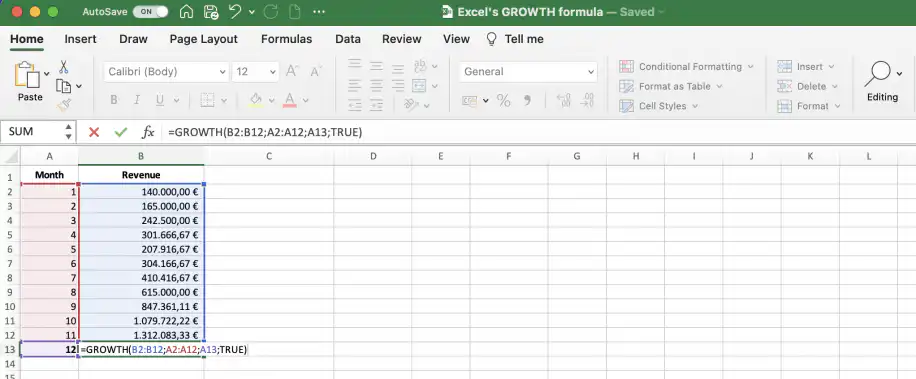
7. Excel will now show the predicted value for the next month in the cell you initially selected.
Use GROWTH to predict an array of values
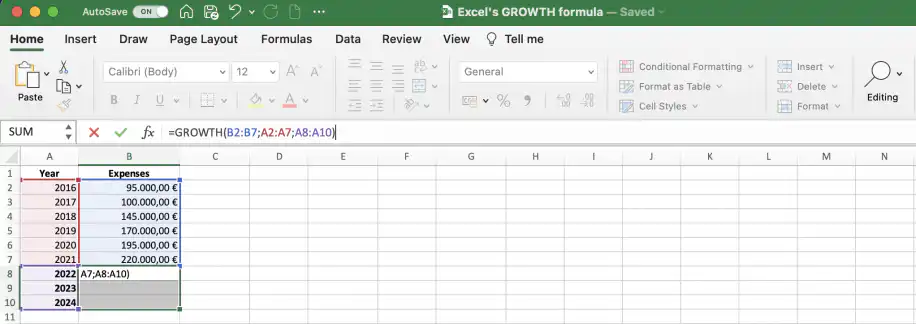
Let’s say your spreadsheet contains values for yearly expenses over the last six years. Use the GROWTH function to estimate the expenses for the next three years, assuming exponential growth.
In the first column, you can include the years, known_x’s, and the second column should contain the values for the yearly expenses, known_y’s. To predict three new values for known_y’s, you’ll need to use the function as an array formula.
1. Select the cells where you want the new values for expenses, new_x’s, to show.
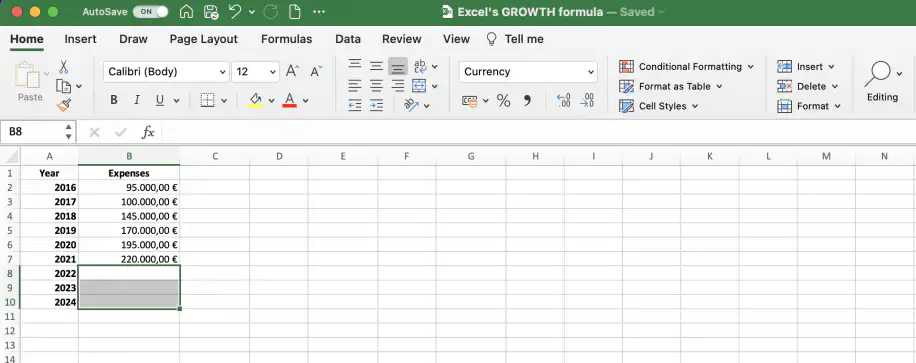
2. Click on the formula bar and type in the GROWTH function. Select the known_y’s and add a semicolon to trigger the next argument.
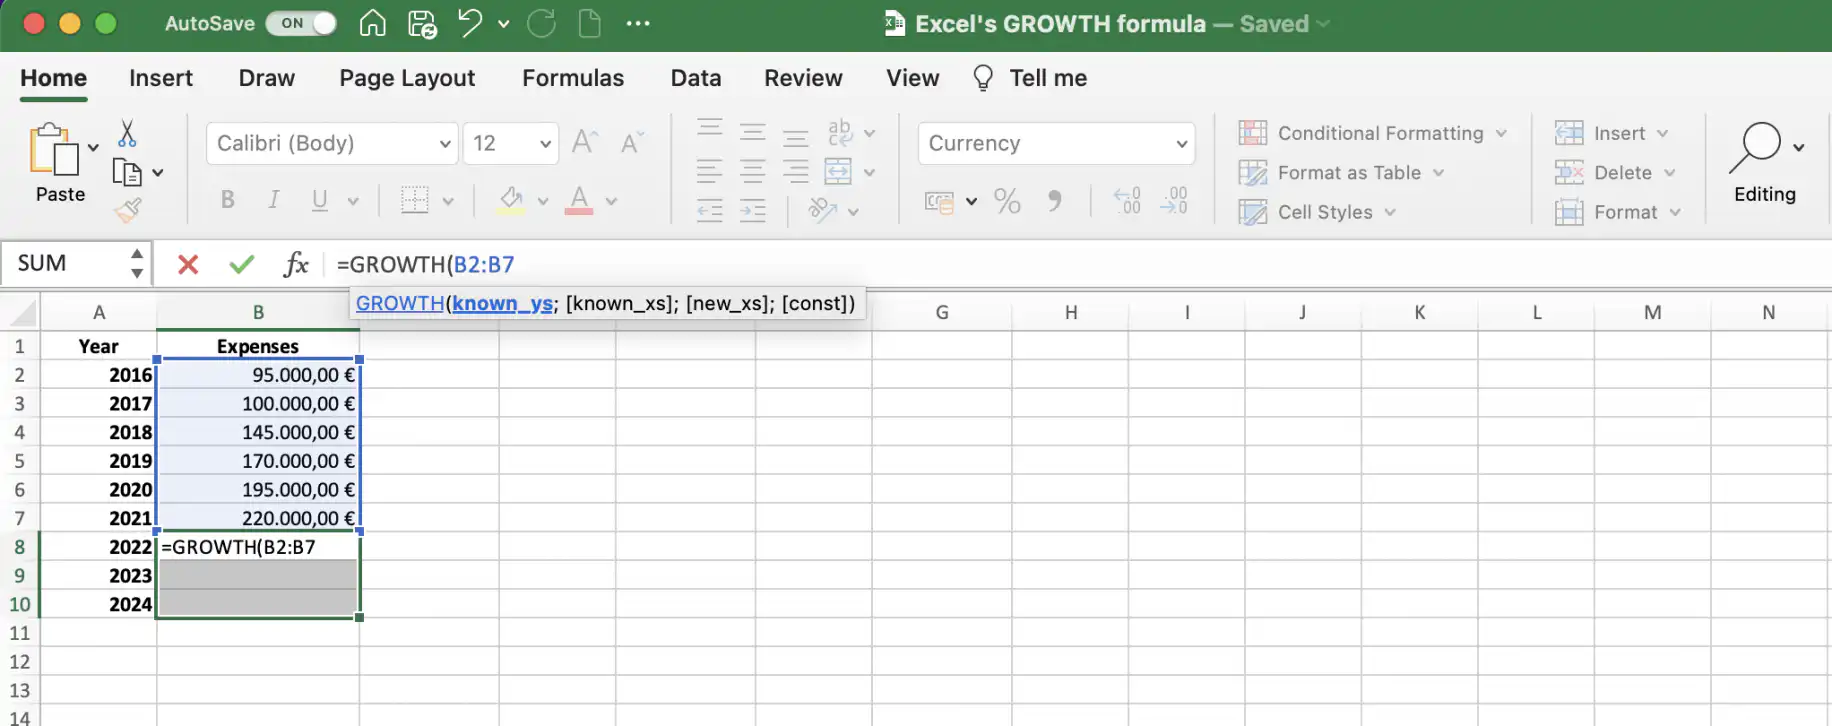
3. Select the known_x’s and add a semicolon to trigger the next argument.
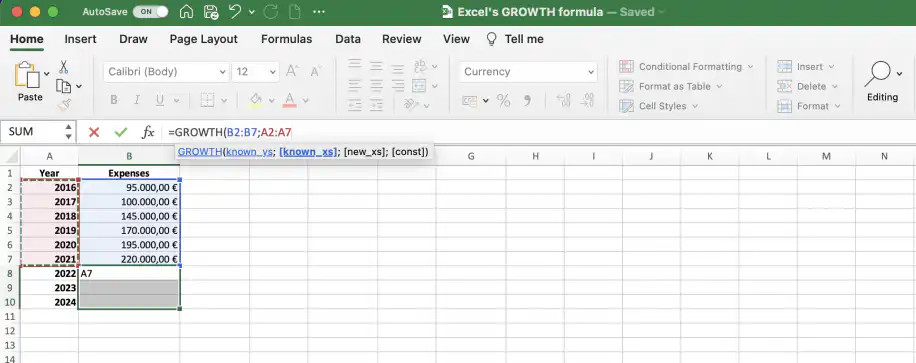
4. Select the new_x’s and add a semicolon to see the options for const.
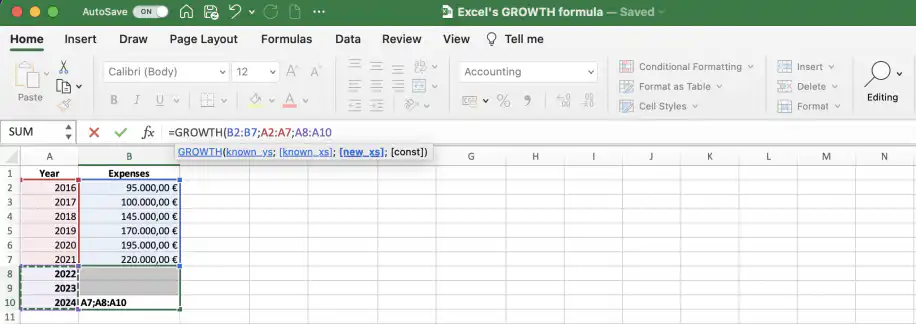
5. The values for const are “FALSE – b is set equal to 1” or “TRUE – b is calculated normally”. If you choose “TRUE” or leave it empty, the value for “b” is calculated. If you choose “FALSE”, it will be set equal to 1.
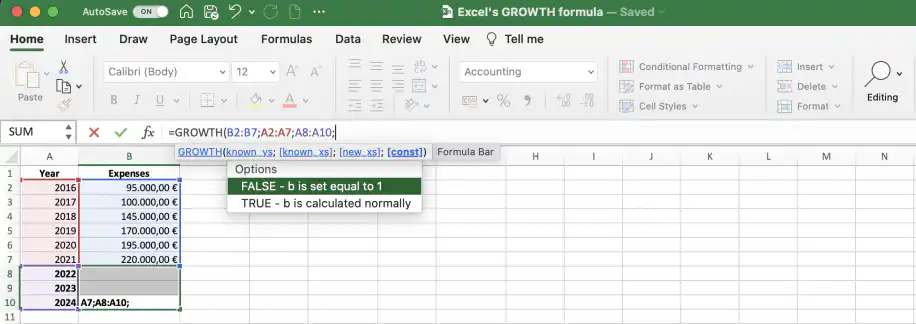
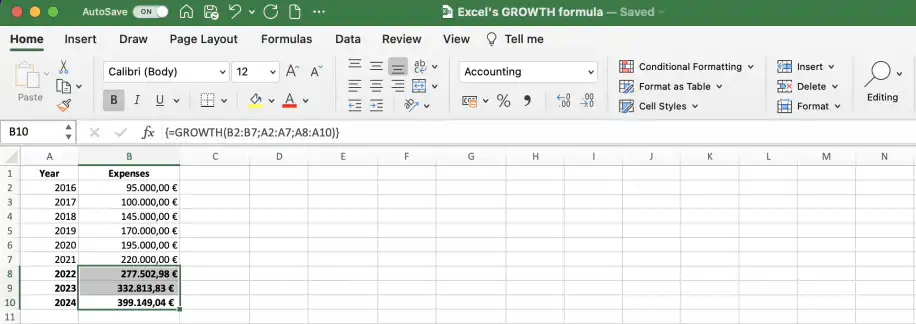
6. After adding the final parenthesis, remember to press Ctrl + Shift + Enter for the array of values to be returned correctly. In Excel for Microsoft 365 and Excel 2021 or later, you can type the formula in the first cell and press Enter. The results spill into the cells below.
7. Excel should now return the predicted values for the next three years in the corresponding cells.
GROWTH function vs growth rate formula in Excel
The GROWTH function and a growth rate formula answer different questions. GROWTH predicts future values, such as next month’s revenue. A growth rate formula tells you how much a value changed, as a percentage.
To get the growth rate between two periods, subtract the old value from the new one and divide by the old value:
=(B3-B2)/B2
Format the cell as a percentage to read the result. Our guide to calculating year-over-year growth walks through this formula with an example.
For the average yearly growth over several years, use the compound annual growth rate (CAGR):
=(end_value/start_value)^(1/years)-1
Excel’s RRI function gives the same result with =RRI(years, start_value, end_value). The CAGR formula guide uses Google Sheets, but the formula works the same way in Excel.
Conclusion
As you have seen, Excel’s GROWTH function is useful if you need a future estimate and the values you already have show exponential growth. For linear growth, the TREND function is more appropriate. To check which pattern your figures follow, start with a trend analysis.
You now know how to use the GROWTH function to predict both a single future value and an array of values based on known values for two variables. In the first example, the function was used to calculate the predicted value for revenue in the next month. In the second, the function was used to calculate the predicted expenses for the next three years.
If your revenue figures live in several spreadsheets, Sheetgo, an AI-powered data automation platform, can pull them into one file on a schedule. Your GROWTH forecasts then run on current data that is ready for AI. To build the full forecast, read our guide to revenue forecasting.

 English
 Español
 Português do Brasil
 Français