




Excel is usually the preferred option for data storage and transformation tasks, especially if you work with large datasets. If your daily routine involves analyzing or interpreting thousands of rows, then it can become overwhelming or, even worse, completely inefficient. If you work in Finance or Sales, it’s likely that you’ll need to identify patterns to make predictions. This will require aggregating cell ranges or summarizing key data while keeping errors or broken formulas to a minimum.
In this article, you’ll learn how to aggregate data in Excel using the AGGREGATE function by getting an in-depth explanation of the AGGREGATE function; then, a detailed view of the formula syntax; and a step-by-step illustration of how to calculate the sum and average of data using the AGGREGATE formula and Excel Power Query.
What is the AGGREGATE formula in Excel?
Excel introduced the AGGREGATE function in the 2010 version. You can use this function to aggregate data in Excel for different purposes, including sums or averages, while having the option to ignore hidden rows and errors.
AGGREGATE formula syntax
The Excel AGGREGATE function can be expressed in two different ways, as a reference formula or an array. The great thing is you don’t need to worry about which one to use since Excel will select the right one for you automatically based on your input parameters.
=AGGREGATE(function_num, options, ref1, [ref2], …)
or
=AGGREGATE(function_num, options, array, [k])
Below, you’ll find what each parameter stands for:
- function_num: This required parameter is expressed as a number, 1 to 19, and specifies the aggregate function to perform.
- options: Another required parameter, expressed as a number from 0 to 7, to identify the range to ignore by the function.
- ref1: This required parameter references the cell range that the function applies to.
- [ref2]: This is an optional parameter, and it expresses any additional cells. Here you can include up to 253 ranges, each divided by a comma (,).
- array: This refers to an array of values or an array formula to which the function is applied.
- [k]: This parameter is only required by certain functions, including LARGE(array, k), SMALL(array, k), PERCENTILE.INC(array, k), PERCENTILE.EXC(array, k), QUARTILE.EXC(array, quart).
How to aggregate data in Excel?
You can aggregate data in Excel by using the reference formula or the array formula, as shown above. Here, you’ll learn how to use the reference form of the AGGREGATE formula to average data in Excel.
How to use the AGGREGATE function in Excel?
AGGREGATE functions can help you perform calculations to return a single value as a summary. The five most common functions are SUM, AVERAGE, COUNT, MAX, and MIN which are also easily accessible through an “AutoSum” button placed in the Home tab. However, these functions are basic and don’t allow for more complex criteria. This is how you can use the AGGREGATE function in Excel to get accurate results.
Let’s say you need to find the average loan amount given to your clients. However, you’d like to ignore the errors included in the cell range. Applying the AVERAGE function to this range would result in an error. However, let’s see what happens if we combine it with AGGREGATE.
1. Type in "=AGGREGATE(" in the first empty cell following your dataset. As you can see, Excel automatically prompts the two types of AGGREGATE formulae. Here, we will follow the reference syntax, since AVERAGE is one of the functions (1 to 13) that use it.
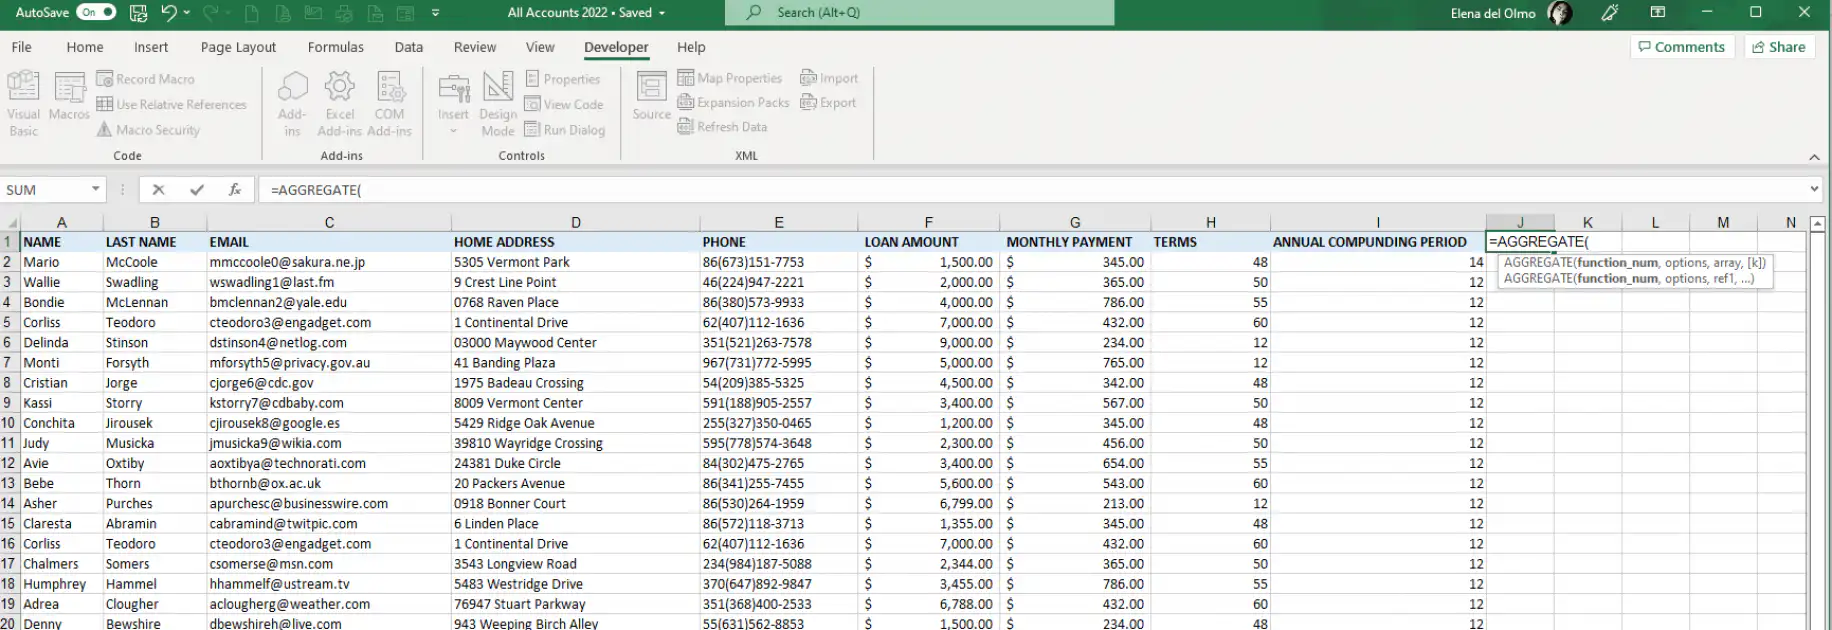
2. Click on the function_num parameter, and Excel will display the list of functions to choose from.
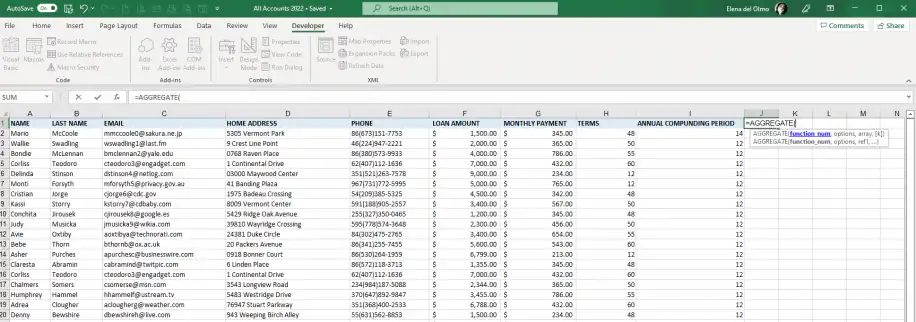
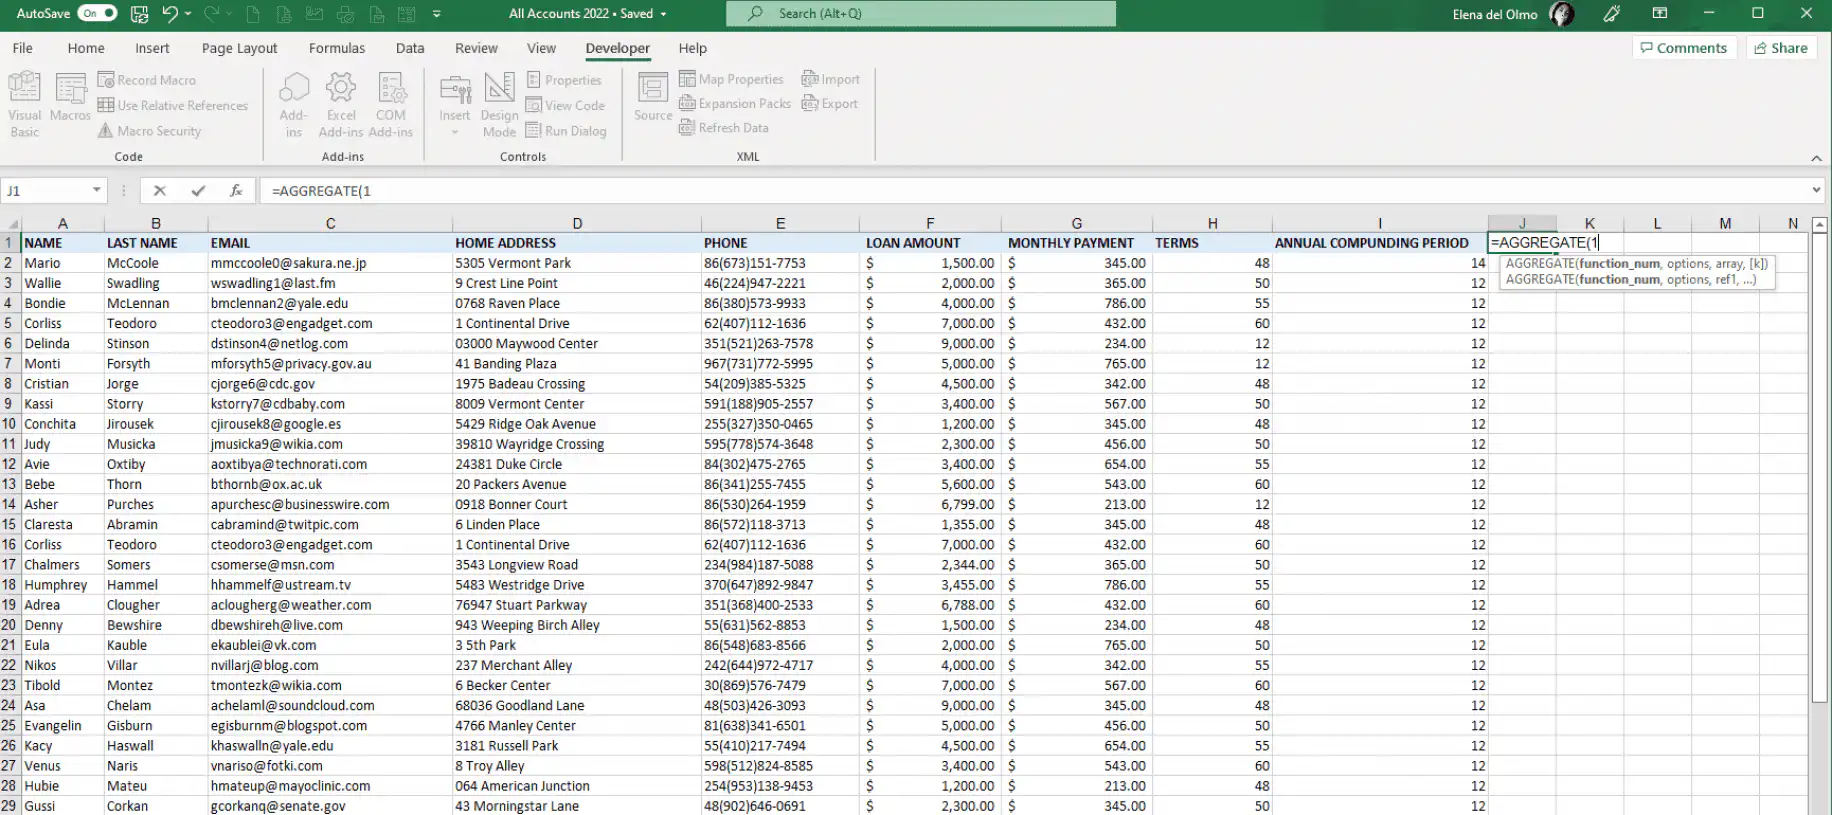
3. Since we want to calculate the AVERAGE, we need to select “1”. Once you finish, type in the comma to proceed to the next parameter.
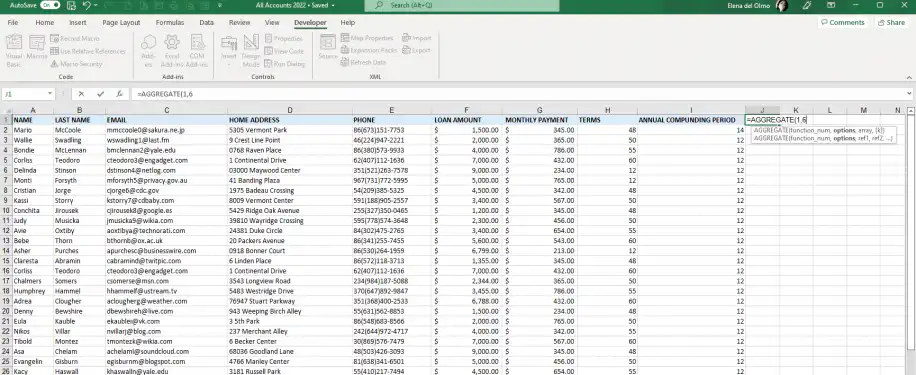
4. Click on the options parameter and select “6” to ignore errors. Type in the comma to include the next parameter.
5. Click on the ref1 parameter and select the range you’d like to calculate with your mouse. Enter the closing parenthesis to complete the formula and press “Enter”.
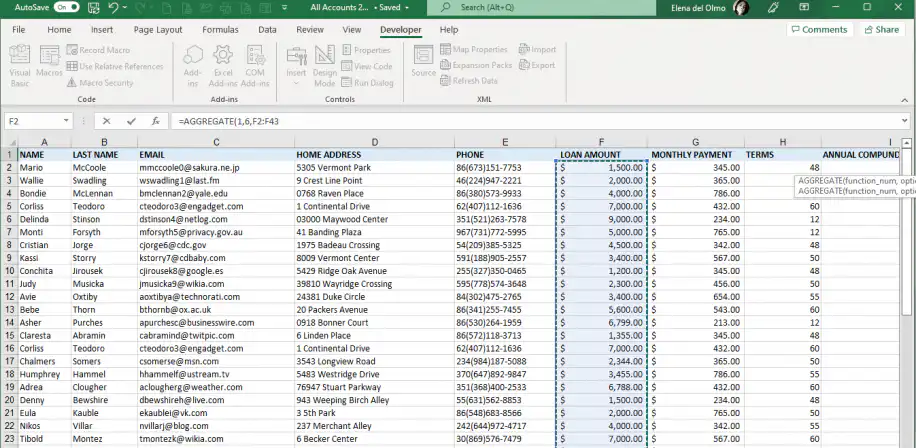
6. As you can see, the AGGREGATE function has returned the AVERAGE of the values in the selected cell range without any errors.
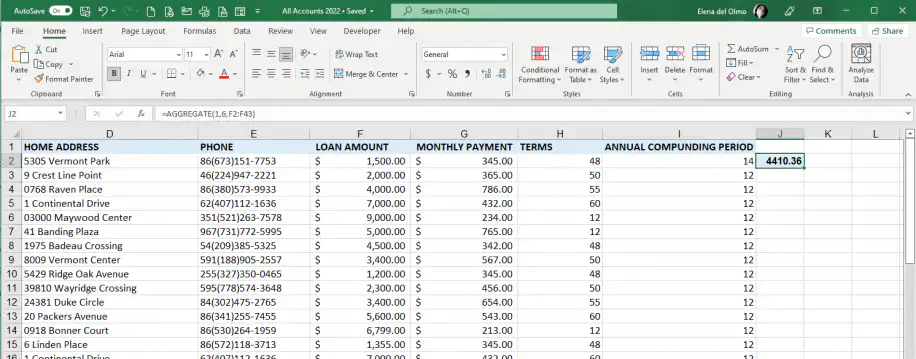
Now that you’ve seen how easy it is to aggregate data using the AGGREGATE function to average values, let’s see how you can aggregate data in Power Query.
How to aggregate data using Excel Power Query?
If you need to summarize data from various sources, using Excel Power Query is the best option. Here, you’ll see how to include a “New Source” in Power Query and apply aggregate features to perform basic calculations such as SUM or AVERAGE.
1. Go to Data > Get Data > From Table/Range.
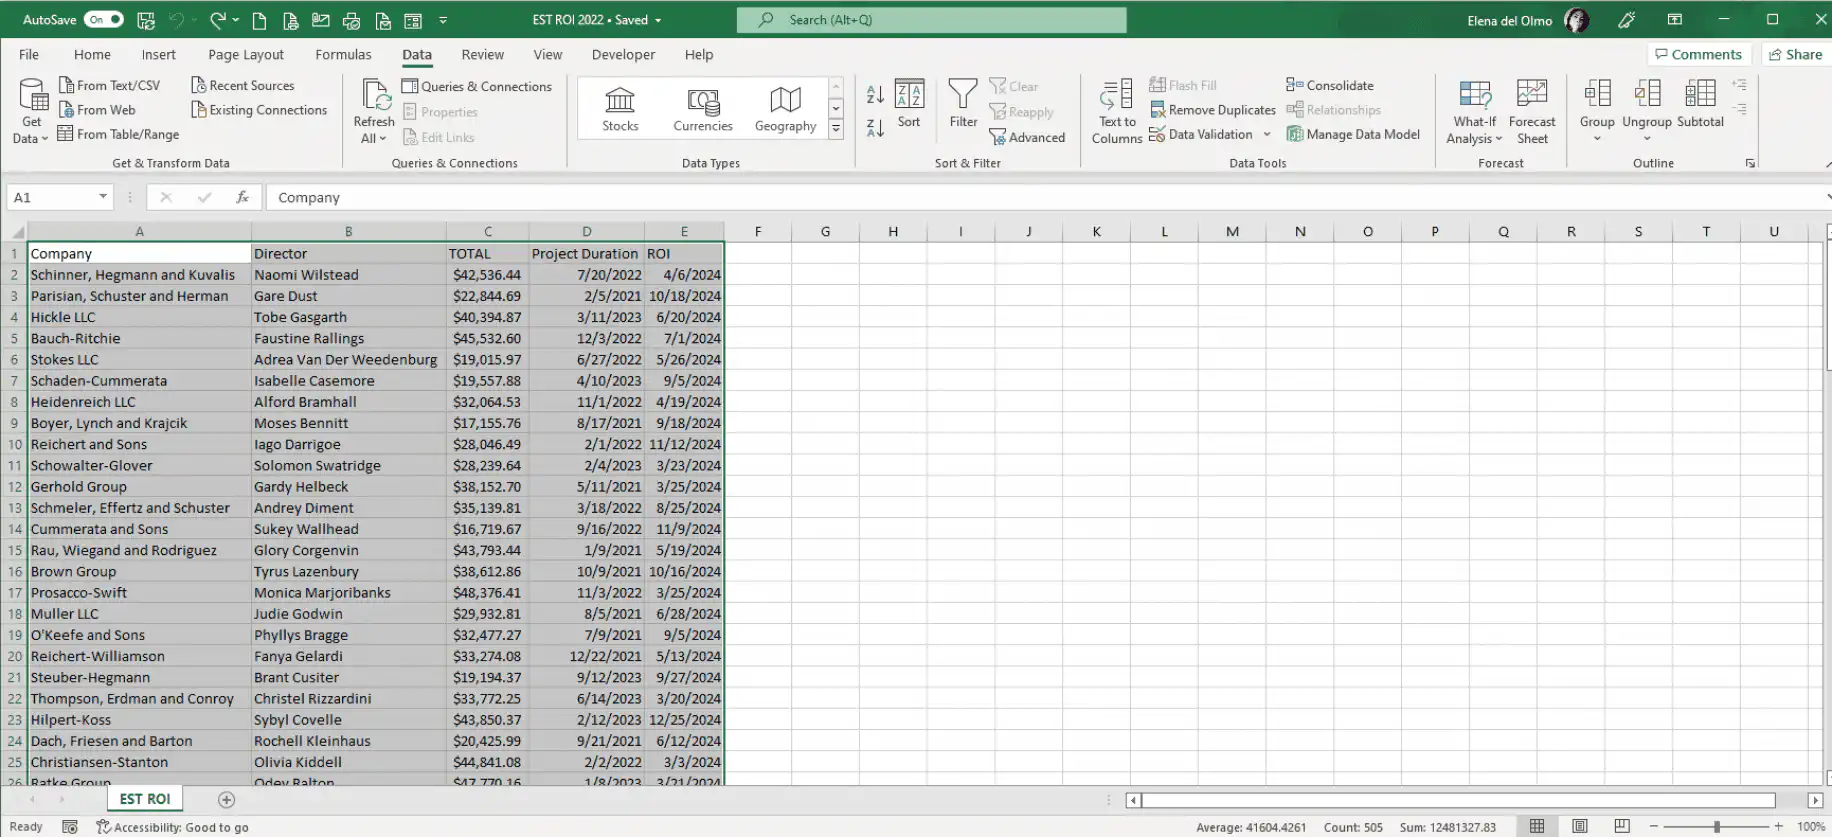
2. You can select this option directly from the ribbon group, as shown below.
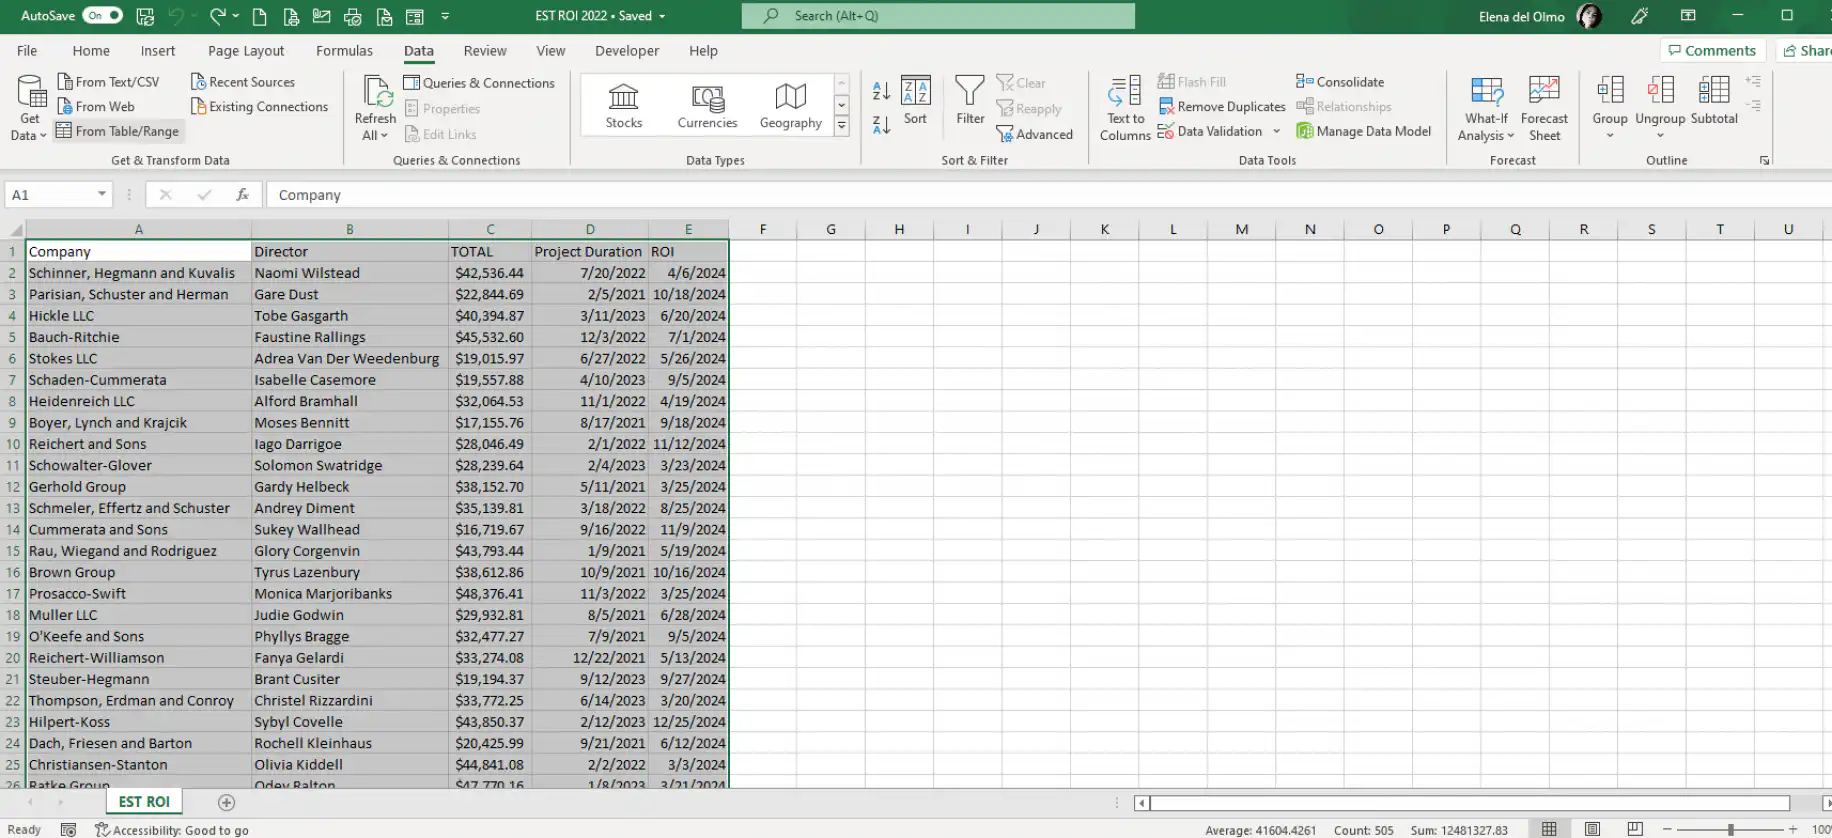
3. Excel will prompt the “Create Table” settings box to confirm the range you’d like to edit in Power Query.
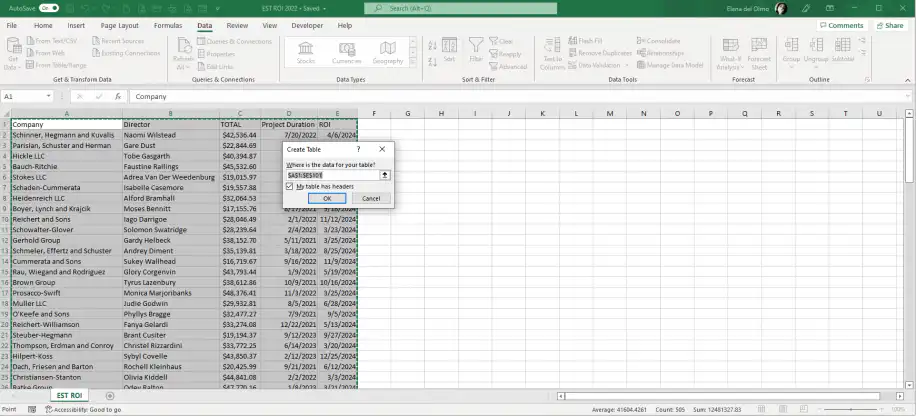
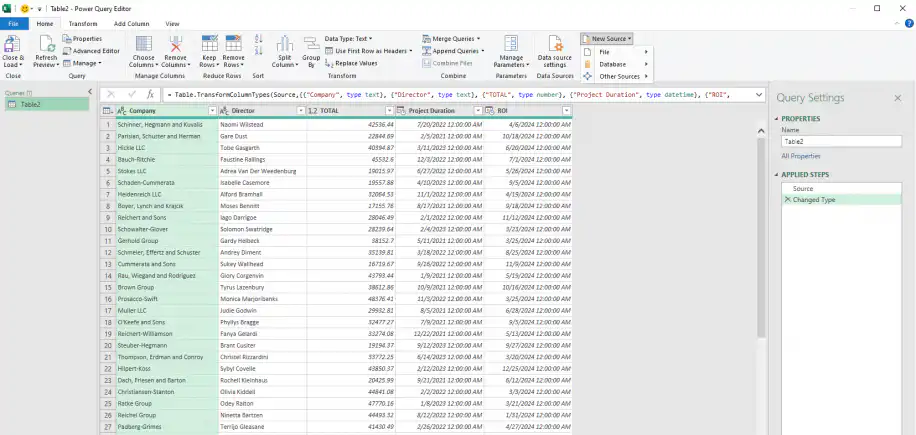
4. In the Power Query Editor, go to Home > New Source > File to add data from a different file.
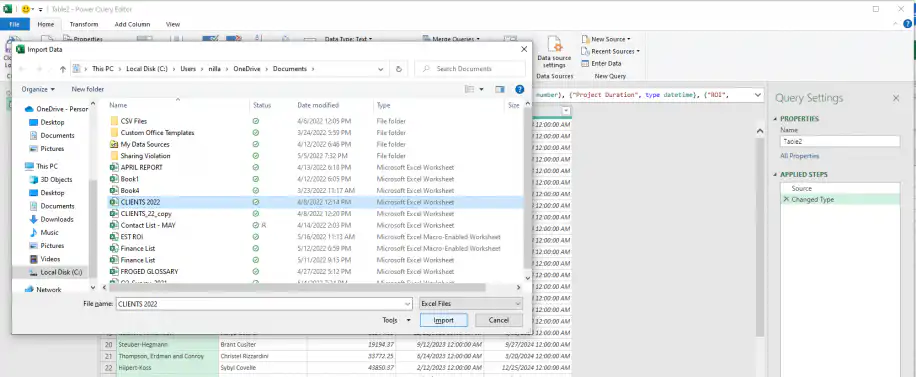
5. Select the file to import data from and then click on “Import”.
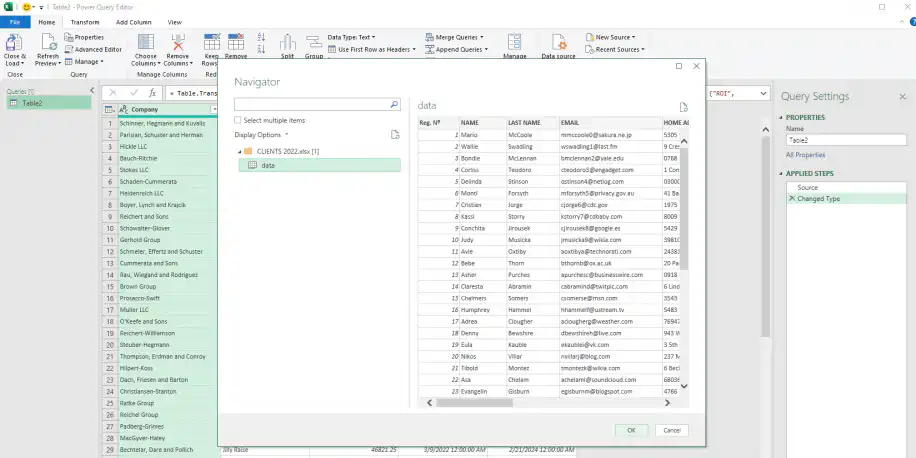
6. In the “Navigator” window, you’ll find a folder containing the new data to import into Power Query. Select the new table source and click “OK”.
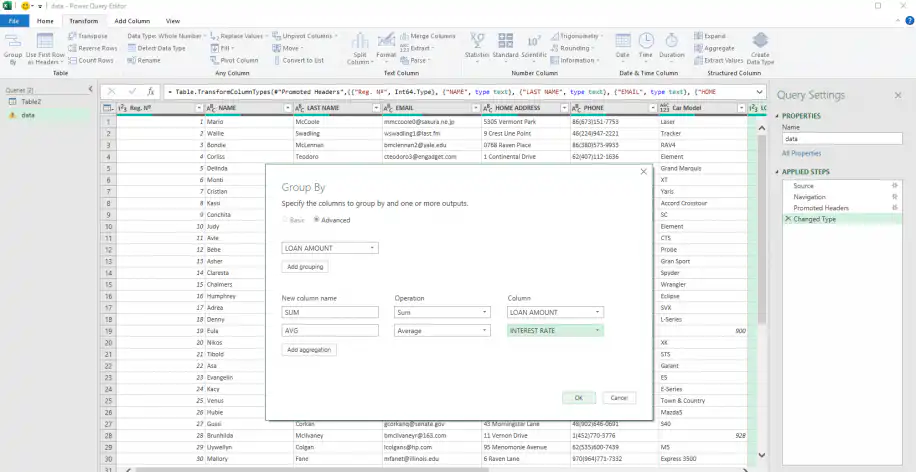
7. Go to Transform > Group By.
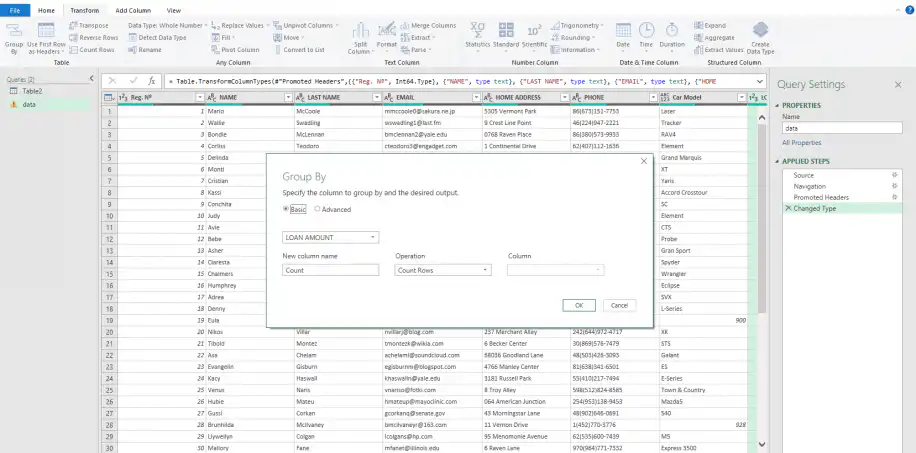
8. This will prompt a new window where you can specify the columns you’d like to group. To use the aggregate features click on the “Advanced” option.
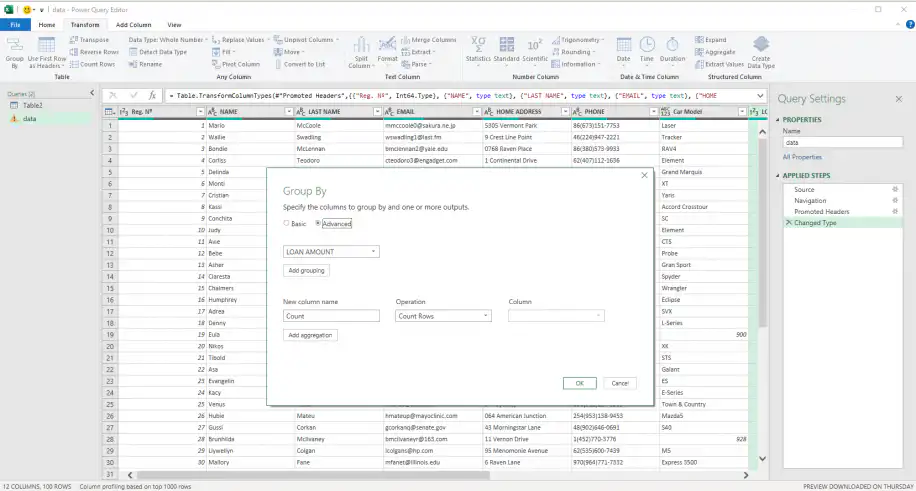
9. Select the first column to group from the drop-down menu. Here, I’ve selected “LOAN AMOUNT”. If you need to include more columns, click on the “Add grouping” button below.
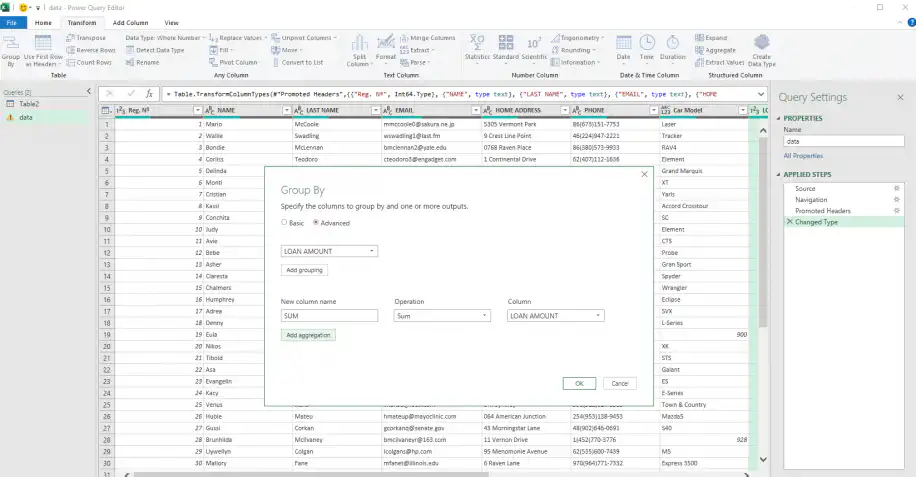
10. To aggregate data according to your preferred calculation, simply type in a name in the “New column name”, select the “Operation”, and then the “Column” containing the values you’d like to calculate. Click on the “Add aggregation” button to include as many operations as needed.
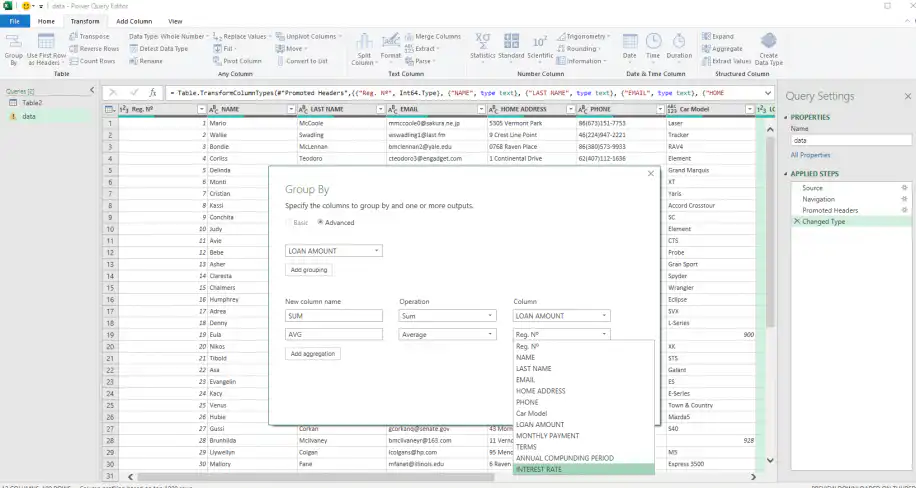
11. Once you’ve selected your criteria to aggregate, click “OK”.
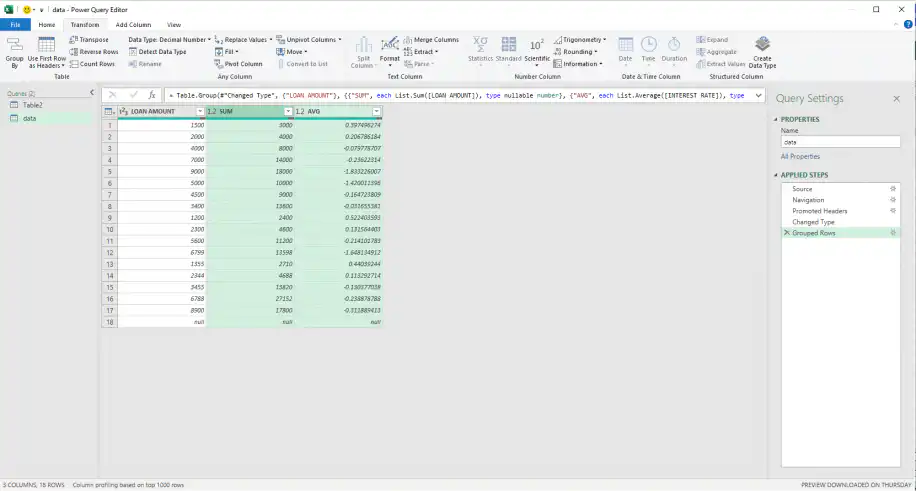
12. As shown below, Power Query automatically outputs the result from all aggregate functions you selected. Moreover, in the “Query Settings” right-side pane, it lists all the actions, i.e., queries, taken to arrive at this result.
Conclusion
One of the most attractive aspects of Excel is the wide range of formulae and calculation features to help users transform and process large amounts of data quickly and easily. Although using Power Query may require more advanced knowledge in Excel, the basic AGGREGATE functions already unlock powerful operations that could not be done manually.
You should now feel comfortable with the AGGREGATE formula in Excel and the basic functions. What’s more, you should now be able to apply the formula depending on what you need to calculate.
If you would like to learn more about the data processing and transformation features Excel has to offer, read through any of the following articles:
- How to consolidate data in Excel (step-by-step)
- Combine multiple CSV files into one Excel file (multiple methods)
- How to combine multiple Excel columns into one?
AGGREGATE isn’t the only way to summarize a range. For totals that depend on a condition, try SUMIF in Excel. To group and total a large table without writing formulas, build a pivot table in Excel. And if the numbers you need sit in several workbooks, you can consolidate Excel files automatically with Sheetgo, an AI-powered data automation platform that keeps the combined data up to date. Try Sheetgo for free with your own files.



 English
 Español
 Português do Brasil
 Français