




If your day-to-day revolves around dealing with multiple spreadsheets containing various types of data, then you’ll be searching for ways to collect data from multiple sources in quick and efficient ways. For example, if you are dealing with financial data, drawing up an annual budget requires combining accounts from various departments according to a pre-established structure. Luckily, Excel includes the Data Consolidation feature that can help you achieve this without any manual work involved, meaning less time and effort on your part.
In this article, you’ll find a full explanation of what Data Consolidation in Excel is and a step-by-step guide on how to consolidate data in Excel from multiple worksheets into a single worksheet. Alternatively, Sheetgo’s AI automations can consolidate data from various sources for you, including Excel and Google Sheets.
What is data consolidation in Excel?
The Data Consolidation feature in Excel allows you to collect data from different worksheets and merge them into one. This worksheet can then be used like a master worksheet, which is the same system used by most automation platforms. This master worksheet links to the source data worksheets, so any time a source worksheet is changed, the consolidated worksheet will be updated.
This type of consolidation tool is widely used by people in Finance, especially those in charge of planning and analysis. Since all data is structured into one table, it makes it much easier for anyone in your organization to carry out the analysis they need.
For a general explanation of the concept outside Excel, read what data consolidation is.
How to consolidate data in Excel?
The Consolidate function can be used to combine multiple Excel columns into one as well as consolidate rows in one same Excel worksheet. Moreover, you can consolidate data from different worksheets into a single worksheet.
Consolidate data from multiple worksheets in a single worksheet
Let’s say you or your manager need to analyze the annual expenses. This will mean compiling the costs associated with different departments, including HR, Marketing, Sales, etc. Each department saves the data on a different sheet. Compiling all this data for a general analysis will be too time-consuming, so a feature like Data Consolidation in Excel is necessary. This is how you can consolidate data in Excel from multiple worksheets in a single worksheet.
1. Create a separate sheet and rename it as “Summary” or a similar term. This is where Excel will create the summary table.
2. Click on an empty cell, preferably the upper-left, to indicate where your summary table starts.

3. Go to Data > Consolidate.

4. Click on the drop-down “Function” menu and then “Sum”, to add the values of all the worksheets.
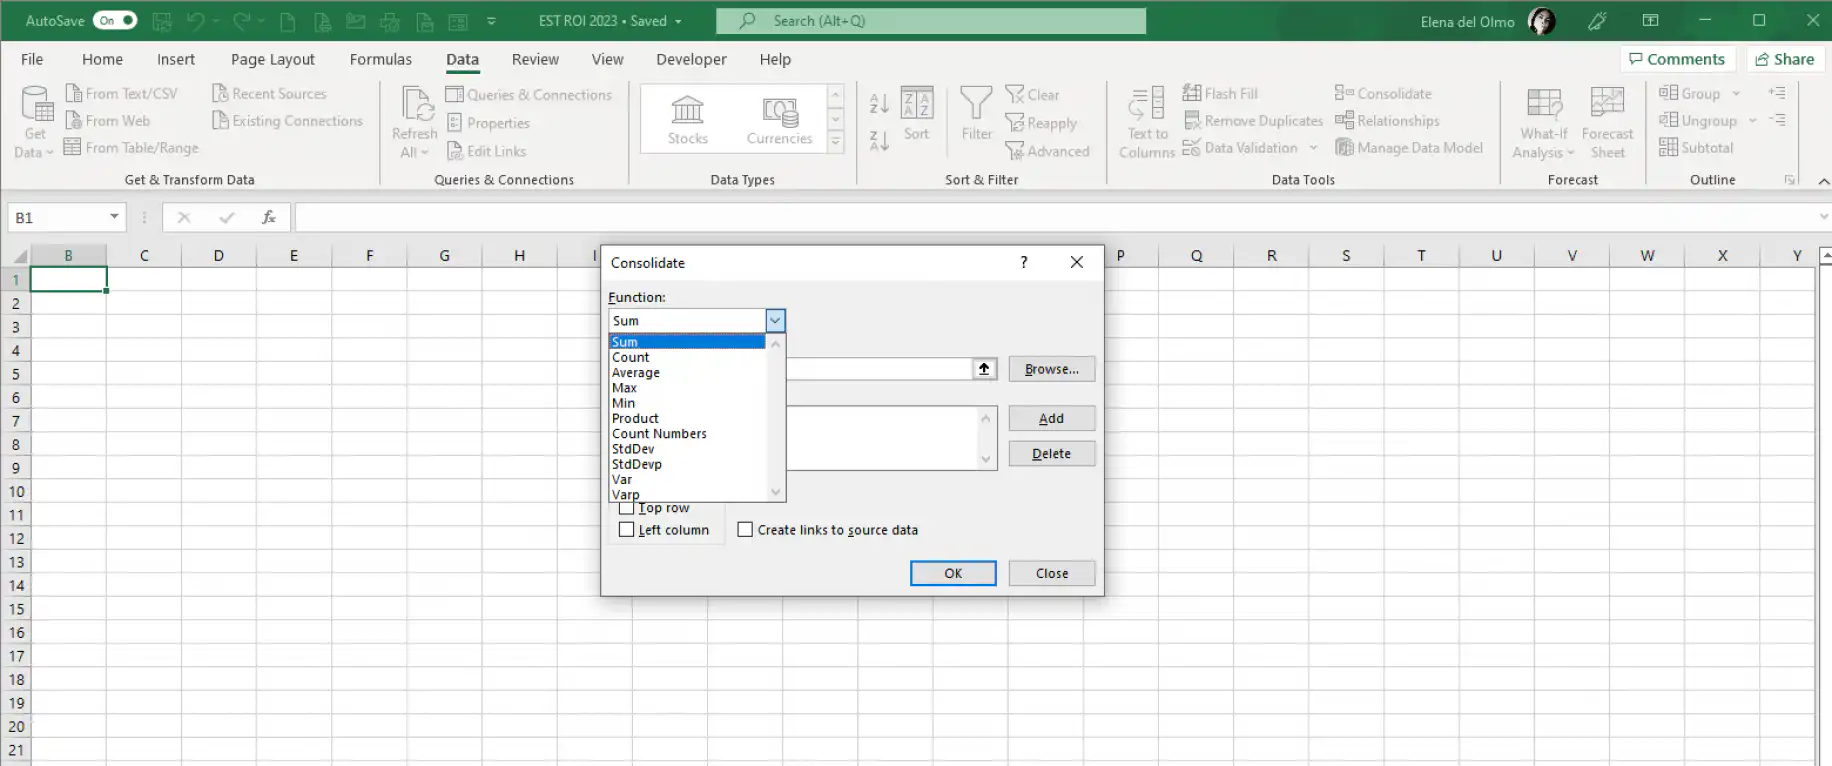
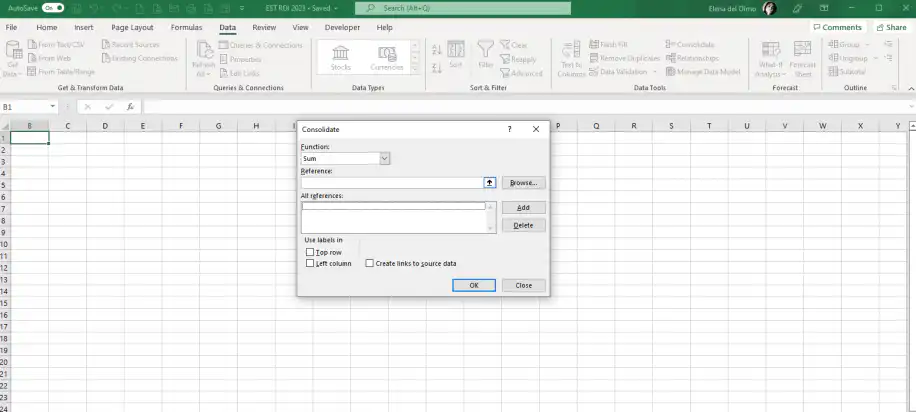
5. In “Reference”, click on the upward arrow button to select the data source to consolidate.
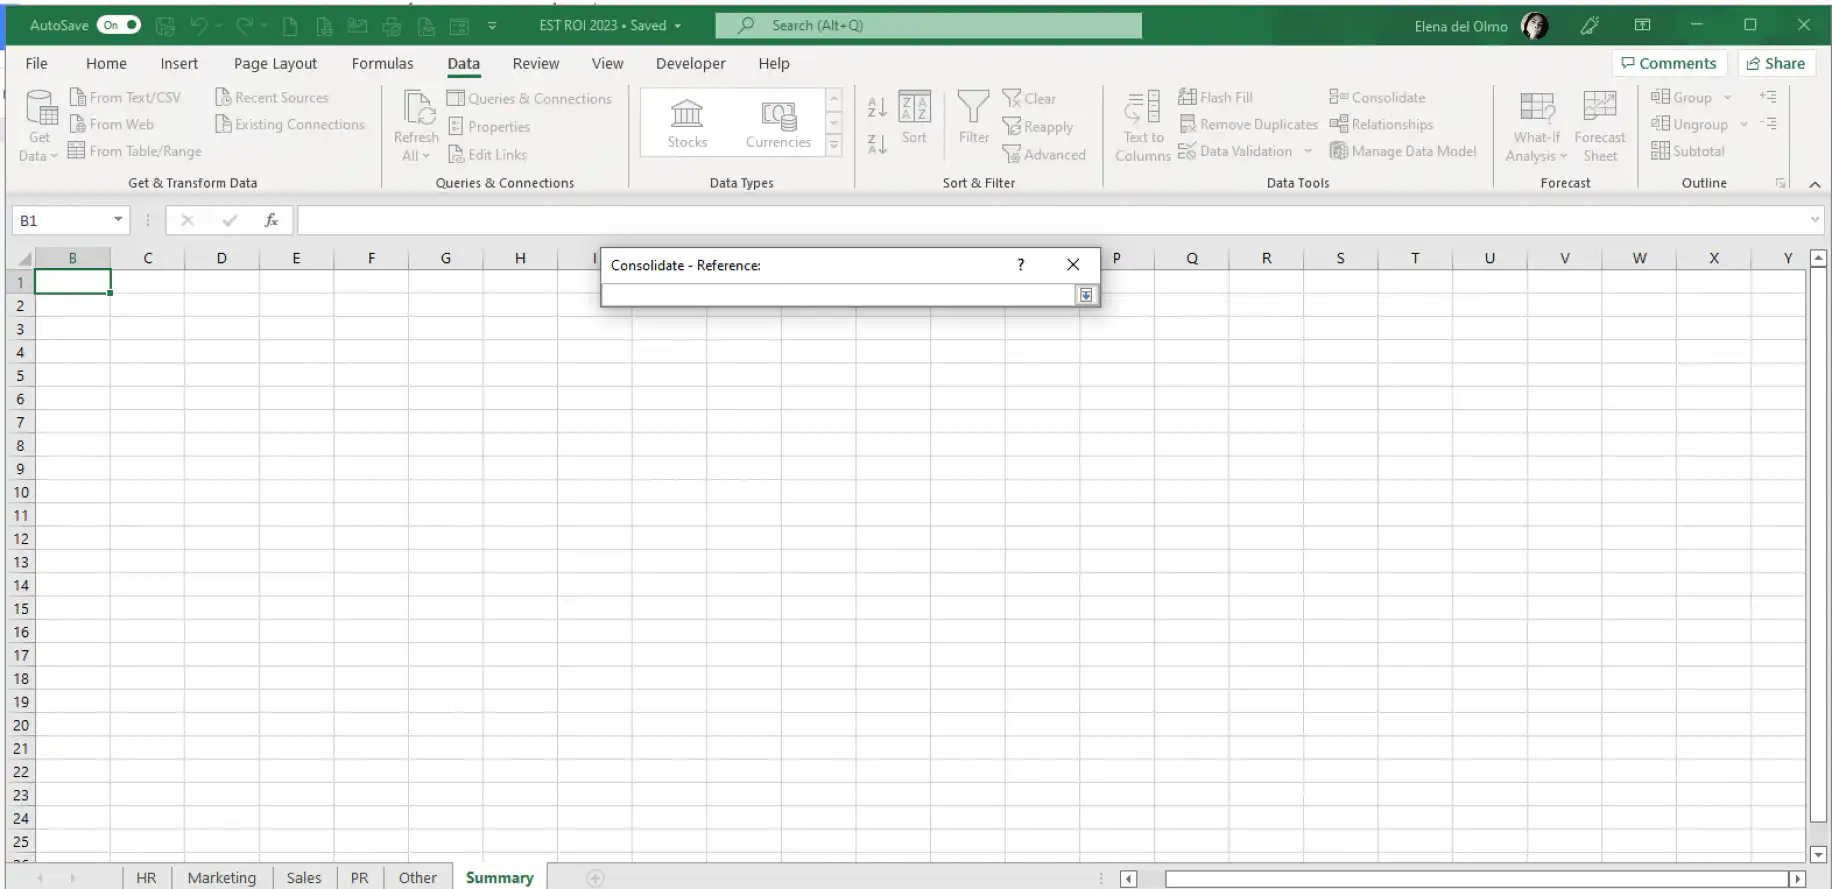
6. A “Consolidate Reference” pop-up will show. Since the source data is in the same workbook, you can simply navigate through the sheets and select the data range by dragging your cursor.
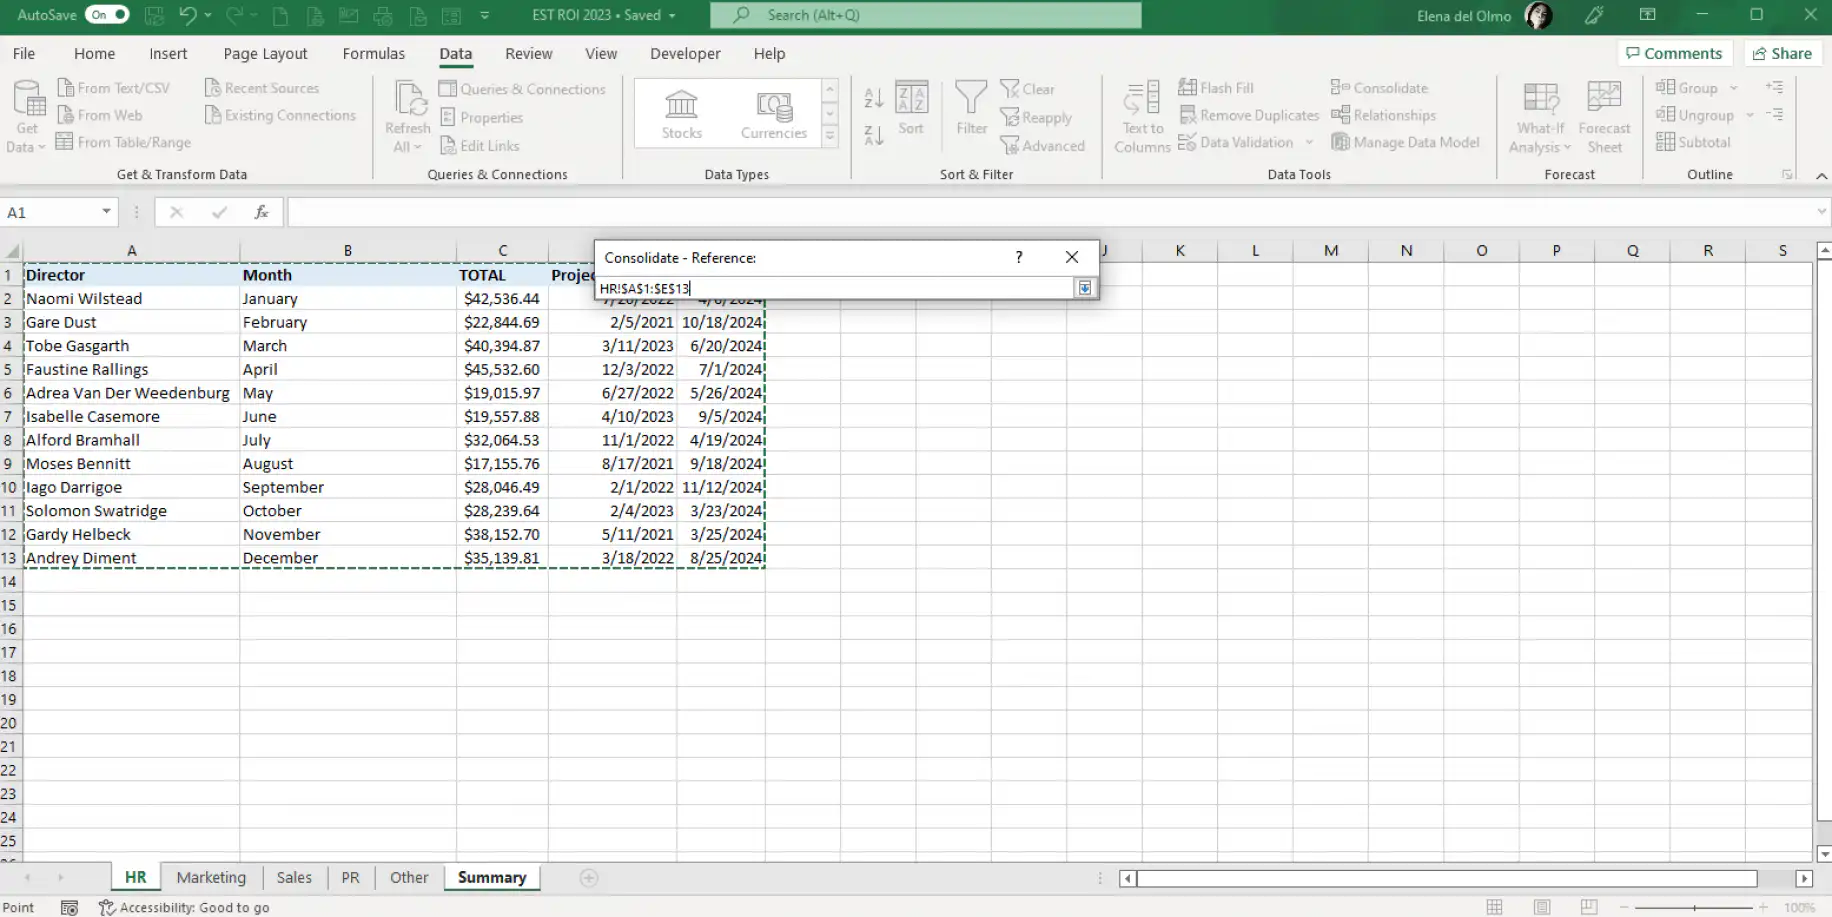
7. As shown below, Excel automatically enters the range of your source data. It shows the worksheet’s name followed by an exclamation mark, the selected rows, and the columns. Once selected, click on the arrow button to head back to the main “Consolidate” settings window.
8. Click on “Add” to include in the “All references” list.
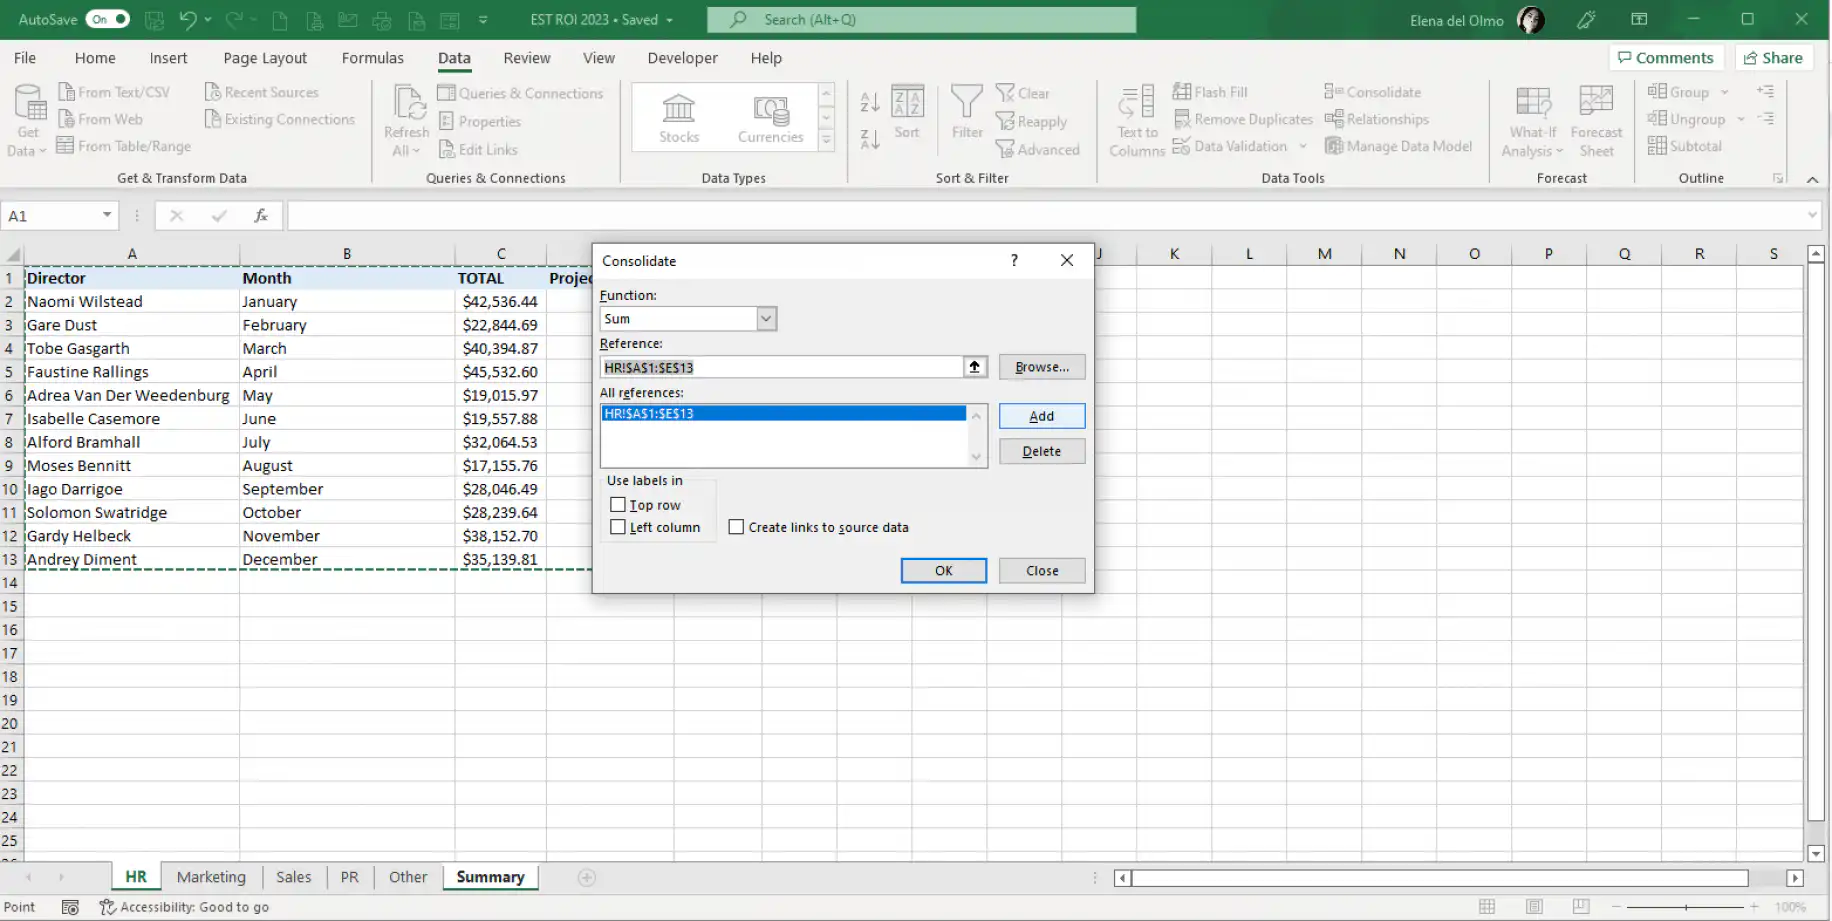
9. Repeat steps 5, 6, 7, and 8 for the remaining sheets. Once you’re done, you should see the full list of reference data, like the one below.
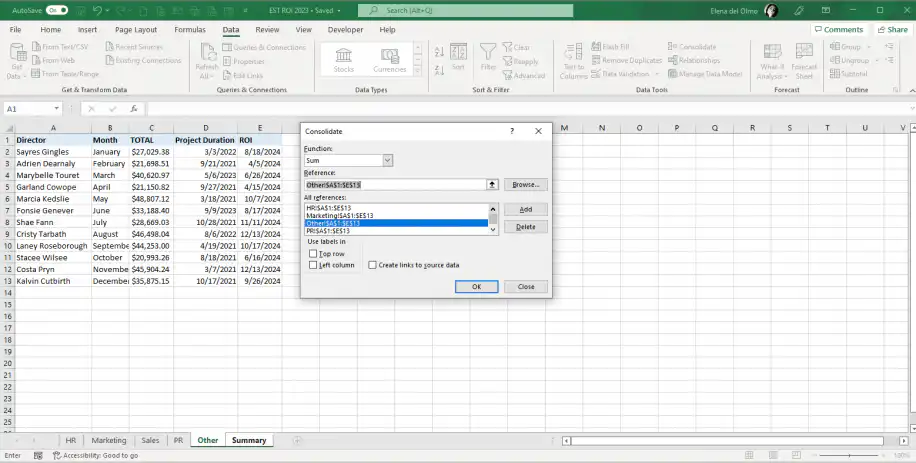
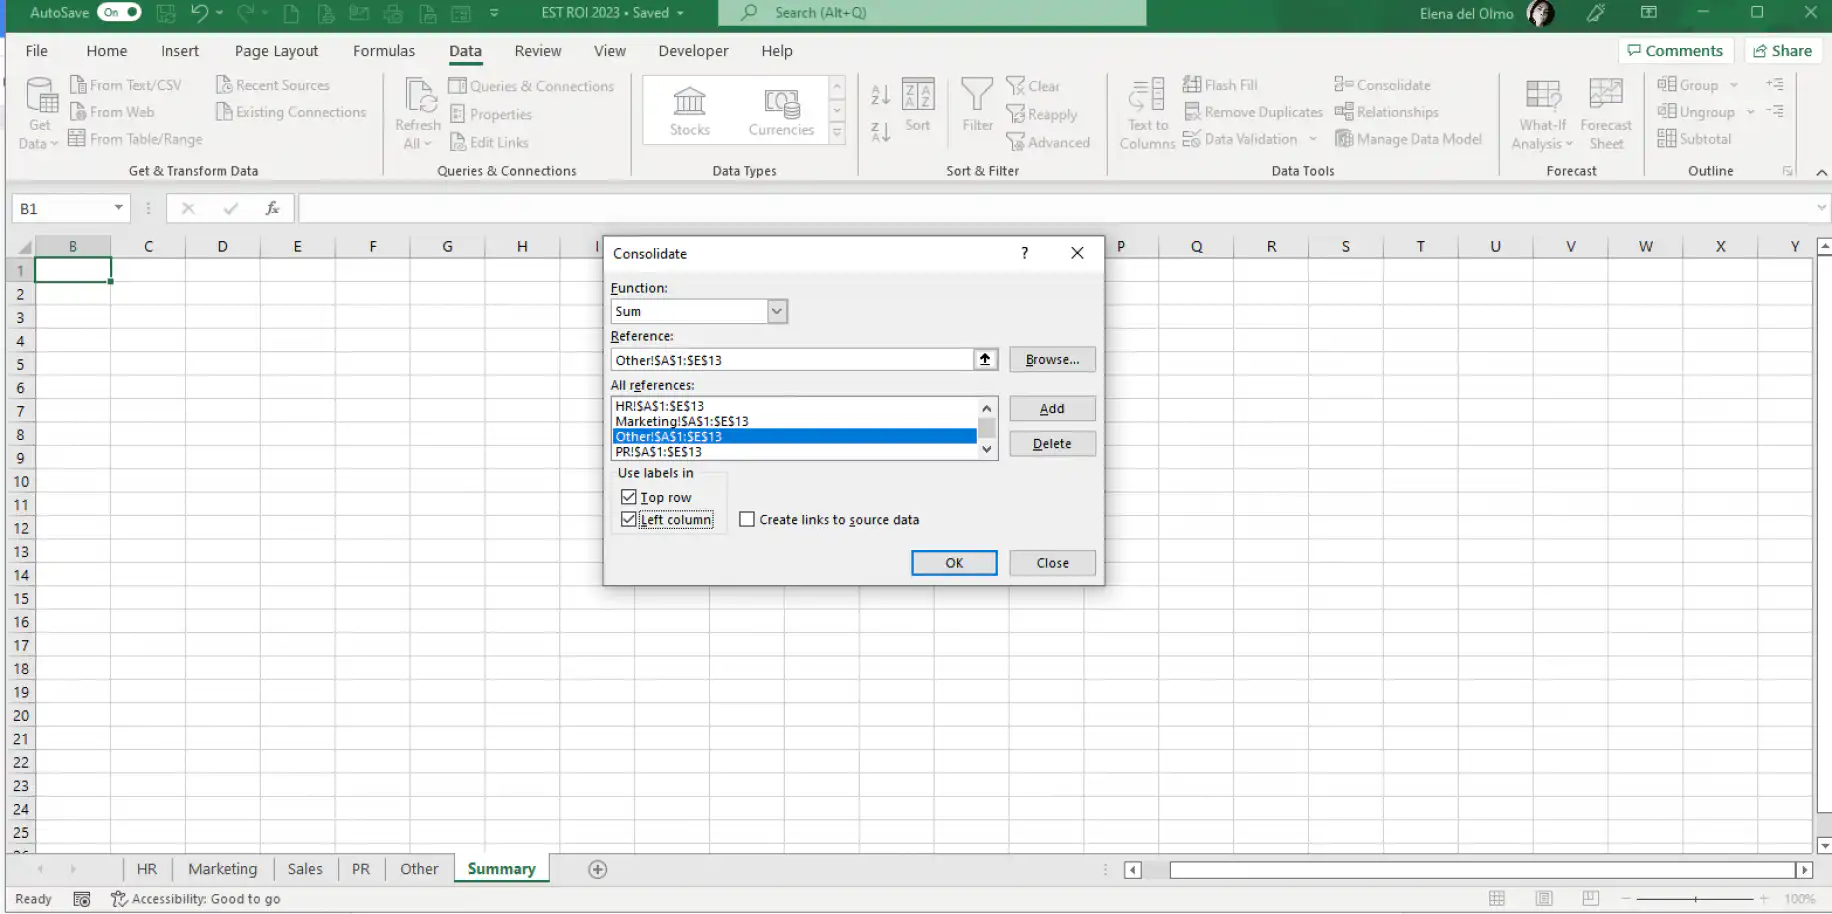
10. Select the “Top Row” and “Left Column” boxes to include labels in the highest rows and labels to the far left. With these boxes ticked, Excel matches values by their labels instead of by where they sit in each range.
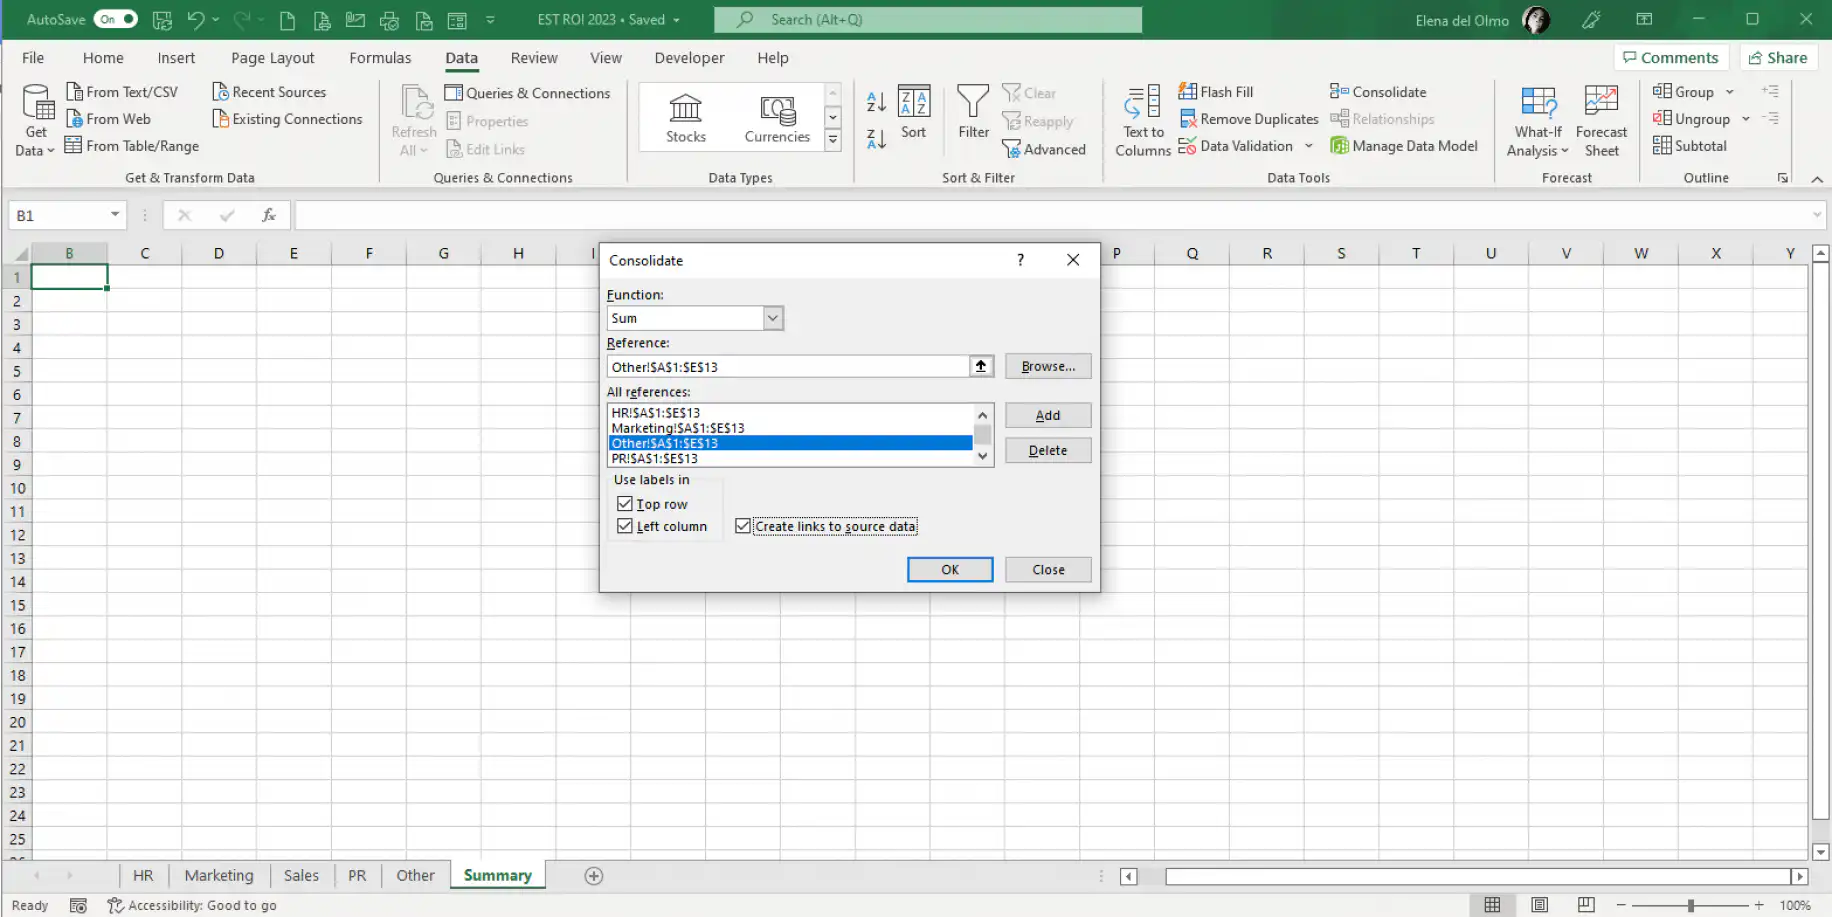
11. Select the “Create Links” option to allow the summary table to update whenever another user changes the source worksheet. If not, you will have to do this manually. Once you’re finished, click “OK”.
12. Click on the ‘+’ buttons to the left to view the original data from the new master worksheet.
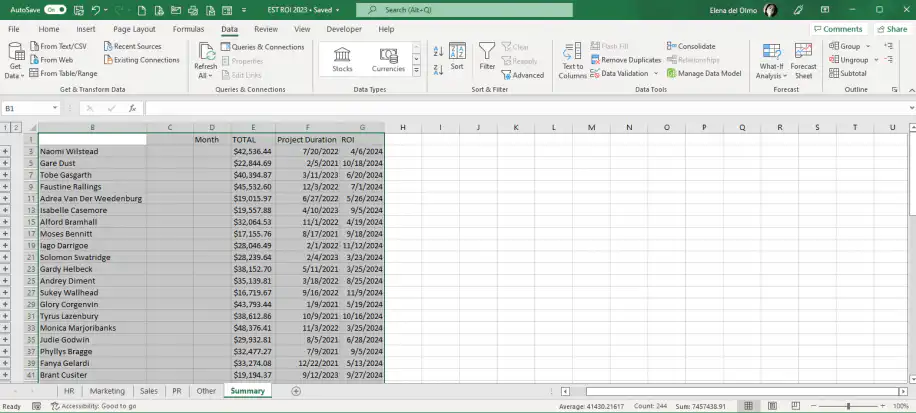
13. If you want to display this original information for all rows, you can click on the number “2” button, right above the first “+” button.
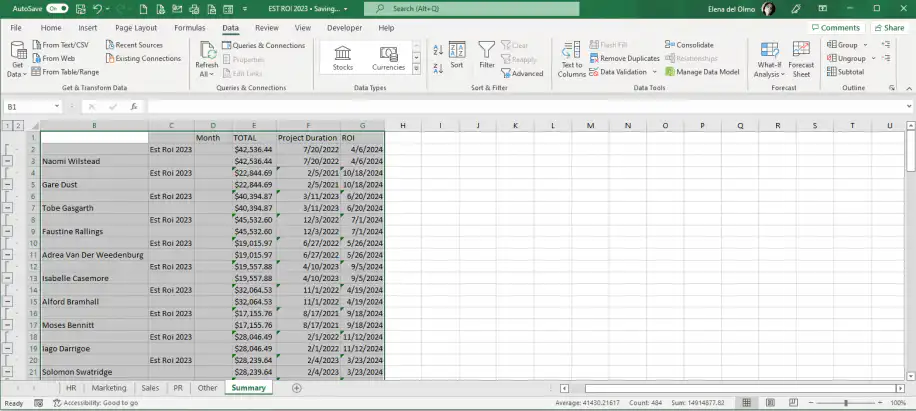
The data shown in Column C refers to the name of the workbook that contains your data. If you prefer to hide this, you can do so by simply right-clicking on it and selecting “Hide”. This is simply telling you that these cells are part of a group that is currently collapsed.
Alternatively, Sheetgo offers full transparency and control over your Excel workbooks. While you focus on data input, Sheetgo’s AI automations consolidate it into your main file. This means that you save time creating new worksheets or new workbooks for summary tables. Check out our post on how to merge Excel files using Sheetgo.
How to consolidate data from multiple Excel workbooks
The steps above assume every department keeps its sheet in the same workbook. If each team sends its own file, you can still use the Consolidate tool. Only the way you pick each reference changes.
1. Open the summary workbook and every source workbook.
2. In the summary workbook, click the cell where the table should start and go to Data > Consolidate.
3. Click in the Reference box, go to the window of a source workbook, and select the range. Excel writes the file name in square brackets before the sheet name. If a file is closed, click Browse and pick it instead. Excel enters its path, and you add the sheet and range after it.
4. Click Add, then repeat step 3 for each workbook.
5. Tick Top row and Left column if the files list their labels in a different order. Tick Create links to source data, then click OK.
With links on, Excel refreshes the summary from the source files when you open it and allow the update. Keep the source files where they are and don’t rename them, or the links break.
When new files arrive every month, adding each one by hand gets slow. You can consolidate Excel files automatically so new data reaches the summary without repeating these steps.
How to consolidate data in Excel from multiple rows
The two label boxes decide how Excel matches your data. With both cleared, Excel consolidates by position: it combines whatever sits in the same cell of each range, so every range needs the same layout. With Top row or Left column ticked, it consolidates by category. It matches values by their labels, so the ranges can list items in any order and can differ in size.
Consolidating by category also works inside one sheet. Say you have a sales log where each rep appears in several rows, one per deal, and you want one row per rep with the deals added up.
1. Click an empty cell away from the source data.
2. Go to Data > Consolidate and choose Sum in the Function menu.
3. In Reference, select the whole list, starting with the column that holds the rep names and including the header row. Click Add.
4. Tick Top row and Left column, then click OK.
Excel returns one row per name with the values summed. The first column of the range holds the labels, so it has to be the column you want to group by. Consolidate only works on numbers, and other text columns come back empty. Create links to source data isn’t available here, because Excel can’t link a result to a source on the same sheet.
How to consolidate data in Excel from multiple columns
Top row does for columns what Left column does for rows. Say the North sheet has columns for January, February, and March, and the South sheet has January, March, and April. Add both ranges, tick Top row and Left column, and Excel builds one table with a column for each month. Values under the same header are added together. April appears only in South, and it still gets its own column.
If you leave Top row cleared, Excel combines the columns by position. The second column of North would be added to the second column of South, even though one holds February and the other March. Skip the labels only when every range has the same headers in the same order.
Data consolidation examples in Excel
The Function menu in the Consolidate dialog sets what Excel does with matching values. Some common uses:
- An annual budget, where each department keeps its costs on its own sheet and Sum adds them up by cost line, as in the walkthrough above.
- Regional sales, where each region sells different products. Sum with Top row and Left column gives one row per product with its total across regions.
- Supplier quotes, one sheet per supplier, where Min returns the lowest price offered for each item.
- Survey results, one sheet per office, where Average gives the mean score for each question.
- Order logs, where Count returns how many numeric entries each customer has across the ranges.
Once the data is in one table, a pivot table in Excel lets you group and filter it further.
Conclusion
Consolidating data is usually one of the most common tasks done by data analysts. The reason is that a better interpretation of data is achieved when viewed in context. However, since it’s likely that each dataset will follow a unique structure or categorization, it’s not enough to copy all data into one single worksheet.
You should now know how the Excel Consolidate data function works for data contained in the same workbook and different workbooks. However, since it’s very likely that your data will be spread out in various workbooks, Sheetgo’s AI automations are a practical solution to consolidate data from different files into one worksheet. The best thing about this is that Sheetgo will do all the work for you.
If you’re interested in other methods to merge and combine data in your spreadsheets, you’ll find these articles useful:



 English
 Español
 Português do Brasil
 Français