


What is a table in Google Sheets?
A table in Google Sheets is a block of related data: a header row that names each column, and one row for each record below it, such as one row per event attendee or per product in stock.
Any range laid out this way works as a table. Since 2024, Google Sheets tables are also a built-in feature. When you start from Insert > Tables, or select your data and click Format > Convert to table, the range gets a name such as Table1, a styled header, a menu on each column header for sorting and filtering, and a type for each column, such as number, date, or dropdown. Methods 2 and 3 below show both ways.
How to make a table in Google Sheets?
You can make a table in Google Sheets in 5 ways:
- Enter data manually
- Insert a table
- Enter data and convert to table
- Create a table with Gemini (AI) directly in Google Sheets
- Make a Google Sheets table in Gemini and Export it
Method 1: Enter data manually
The first way to make a table in Google Sheets is to enter data into cells manually.
- In the first row, enter the column names representing the data you want to track.
- Use the remaining cells to enter your data.
For example, I created a table to store attendee data from an online event.

You can save daily hours by automating Google Sheets workflows and eliminating manual data entry. For example, you can sign up for Sheetgo, an AI-powered data automation platform, to create forms to collect data from users and automatically populate your Google Sheets file.
Method 2: Insert a table in Google Sheets
This method is helpful if you want to start with a blank table structure.
1. Click Insert > Tables at the top menu bar.


Method 3: Enter data and convert to table
On May 14, 2024, Google announced a new way to make a table in Google Sheets. Here is how it works:
1. Manually enter your data in Google Sheets


This method is also impressive because it allows you to format columns quickly.
3. Click the arrow next to a header element and choose Edit column type > Dropdown.


Method 4: Create a table with Gemini directly in Google Sheets
The fourth way to create a table in Google Sheets is to use Gemini, Google’s AI.
1. Select the cell where you want the table to start from and click the Gemini icon in the top-right corner of your Google Sheets. Then, write your prompt in the bottom-right corner and press “Enter” on your keyboard.


However, you can still click the “Retry” icon to ask Gemini to try again.

Method 5: Create a Google Sheets table directly in Gemini
The fifth way to make a table in Google Sheets is in Gemini.
1. Start a new chat in Gemini.

Here is the prompt I used:
“Create a sales inventory table for a shop that sells electronics. The table should have 15 rows and the following columns: Item ID, Product Name, Category, Stock Quantity, Unit Price, Total Value”


Table advanced formatting options
Google Sheets provides various advanced table formatting options to create professional-looking tables, such as:
1. Conditional formatting
Conditional formatting changes the appearance of cells (like background color, text color, or font style) depending on the data they contain or their relationship to other data. For example, you can use conditional formatting to highlight duplicates in Google Sheets.

2. Alternating colors
Alternating colors are excellent for large tables with many rows or columns. They help you easily follow the data across the table.

3. Filters
In Google Sheets, a filter allows you to isolate relevant information without altering the original dataset. It can also temporarily hide rows that don’t meet specific criteria.
For example, here is my table before applying any filters:


For more information, check out our complete guide on Google Sheets filters.
There are also more ways to format your tables in Google Sheets, like:
- Custom Number Formatting
- Charts
- Pivot Tables
- Custom Formulas
- Filter Views
- Tools
How to make a collapsible table in Google Sheets?
If you’re dealing with a large table, you may want to be able to collapse the rows or some of the columns. While you can do this by hiding rows or columns, it can get tricky and lead to mistakes. Instead, you can group rows or columns to make your table collapsible.
Group table rows
Follow the steps below to group the table’s rows.
1. Select all rows except the headers.
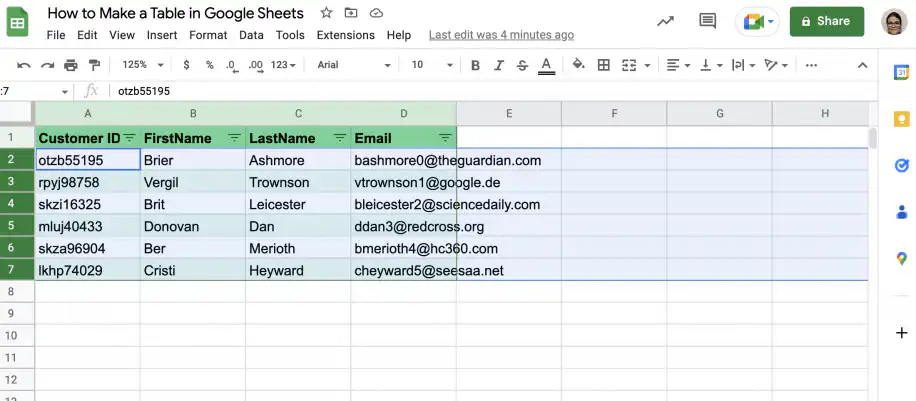
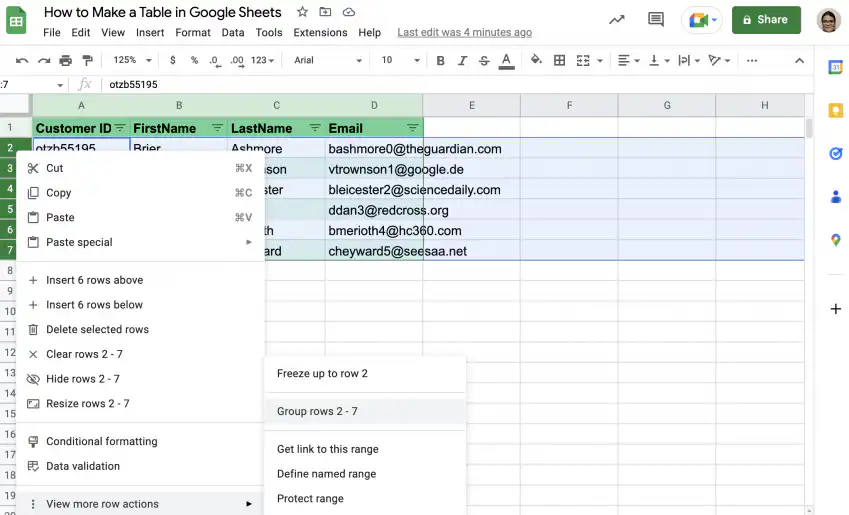
2. Right-click in the row number area to get the menu and click “View more row actions”. Select the option to group rows.
3. Click the minus symbol in the top-left corner to collapse the rows.
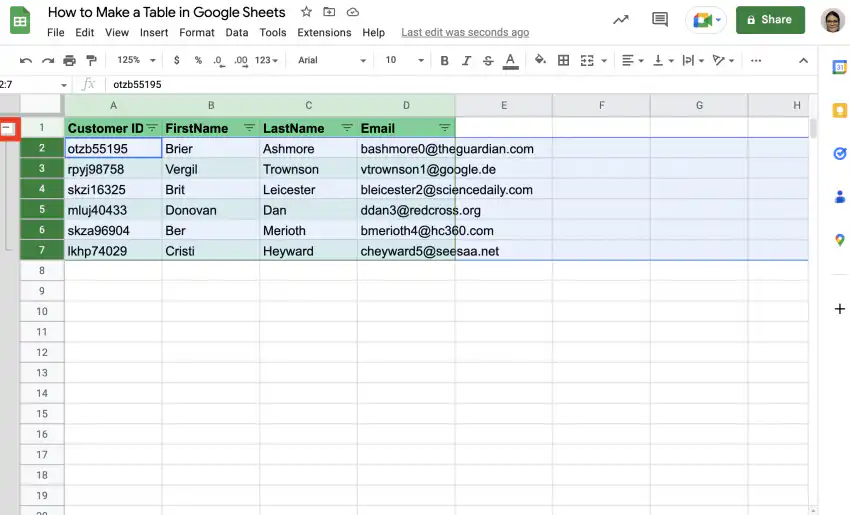
4. That’s it. To expand the table, simply click the plus symbol in the top-left corner.

Group table columns
Follow the steps below to group table columns so you can collapse and expand them as needed.
1. Select the columns you want to be able to collapse.
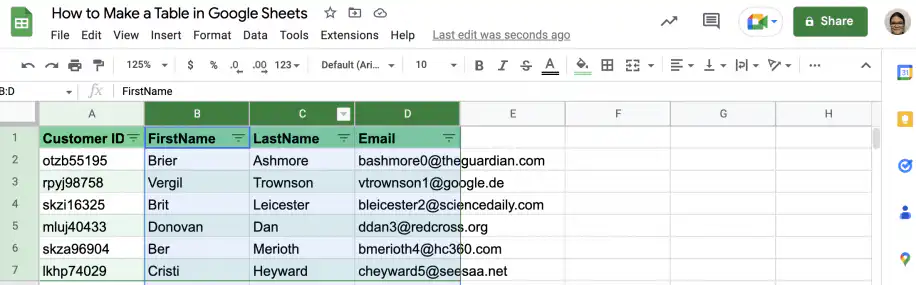
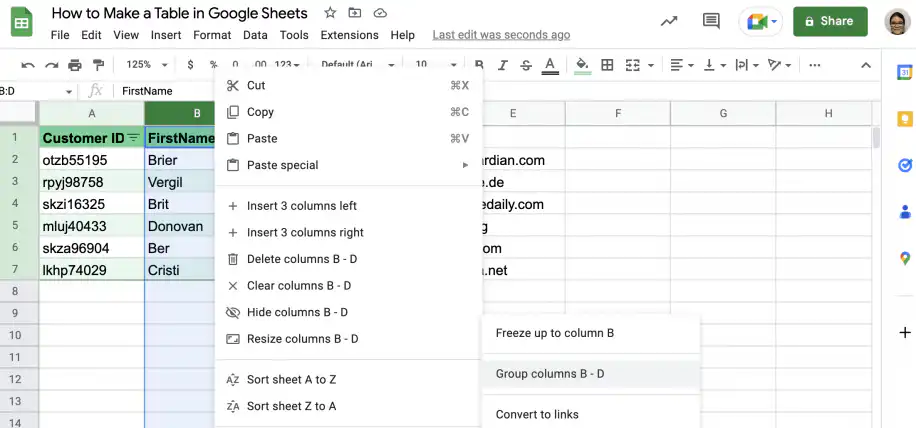
2. Right-click in the area with the column letters to get the menu, and click “View more column actions”. Select the option to group columns.
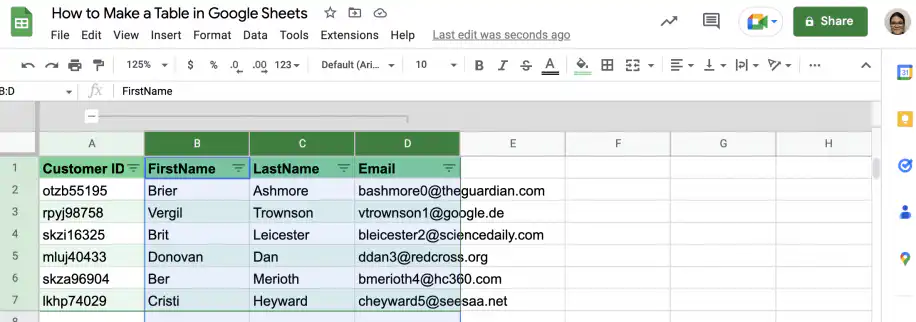
3. Click the minus symbol above the first grouped column.
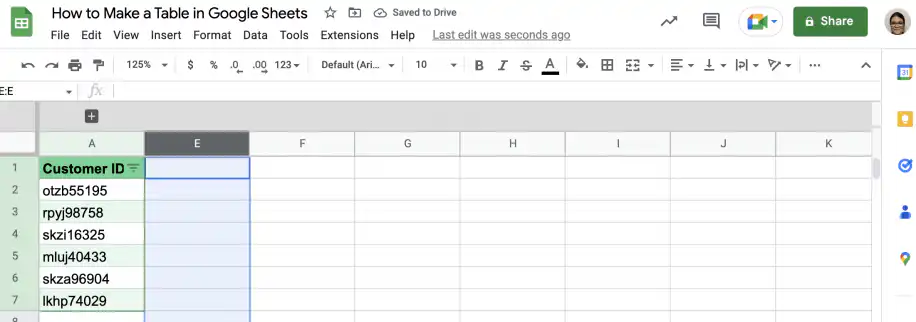
4. That’s it. To expand the columns, click the plus symbol shown below.
How to name a table in Google Sheets with named ranges?
If you frequently refer to data in your tables in other tables or formulas, named ranges will save you a lot of time. You can name the entire range, as well as individual columns. This allows you to search for and manipulate data by referring to the range name or the column name.
Below, you have step-by-step instructions on how to name your whole table, as well as specific columns within that table. Finally, you have an example of how to use a named range in a Google Sheets function.
1. Select the range of cells containing your table.
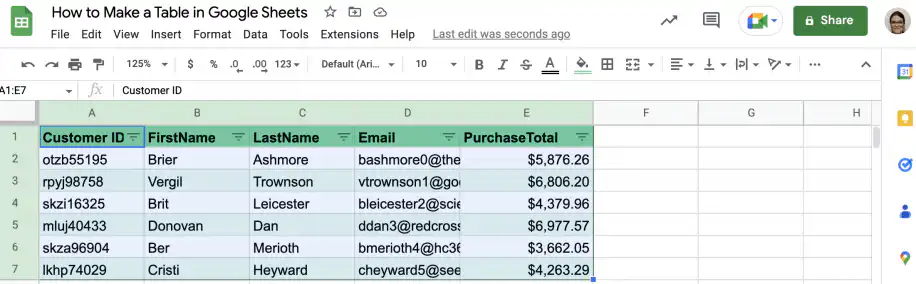
2. Go to Data > Named ranges.
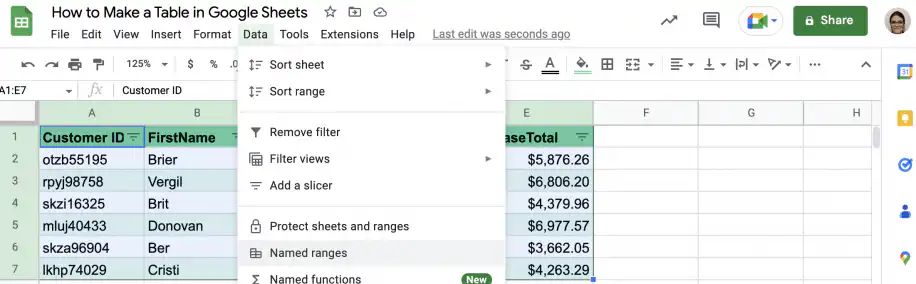
3. Type in the name you want to use for your table and click “Done”.
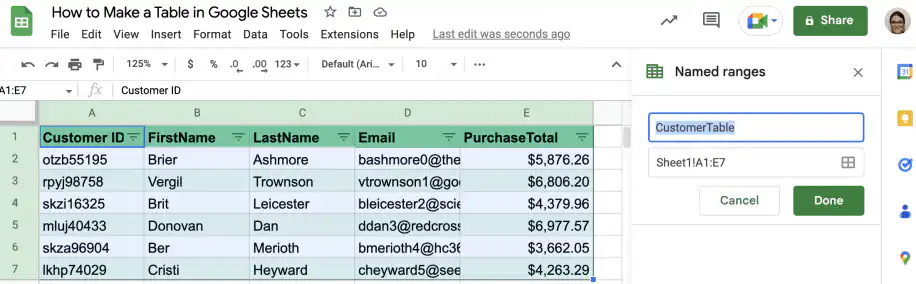
4. The table now appears in the “Named ranges” sidebar.
5. To name a column in your table, select the column and click “Add a range”.
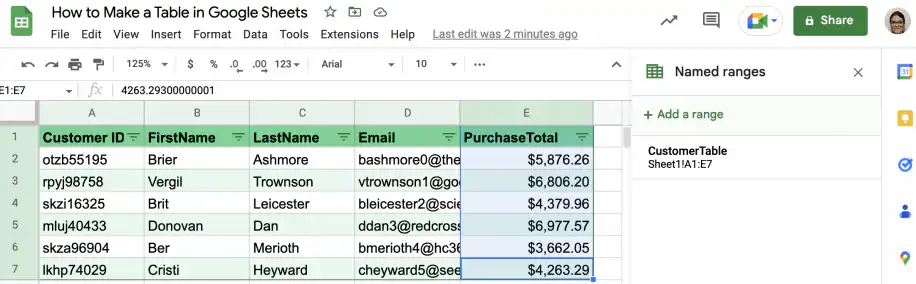
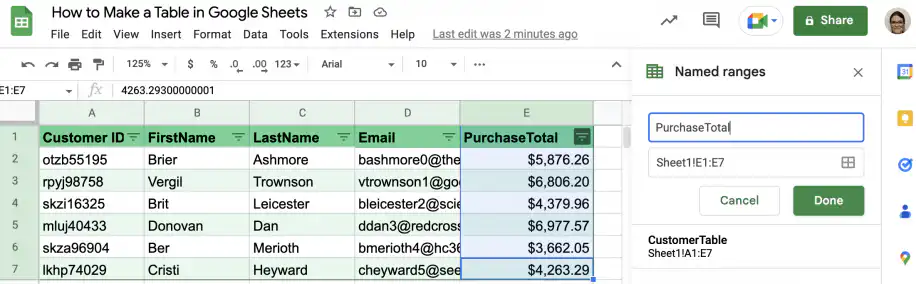
6. Type a name for the column, such as PurchaseTotal, and click Done. Now that the column has a name, you can reference it from other cells, for example to find the total sum of purchases.
7. In an empty cell, type in the SUM function.
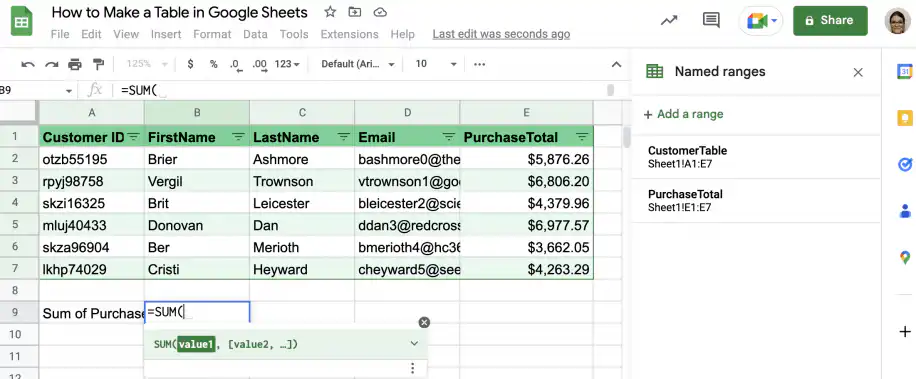
8. After the parenthesis, start typing the name of the column. You will see a suggestion box like the one below. Click or hit the Tab key to select the column.
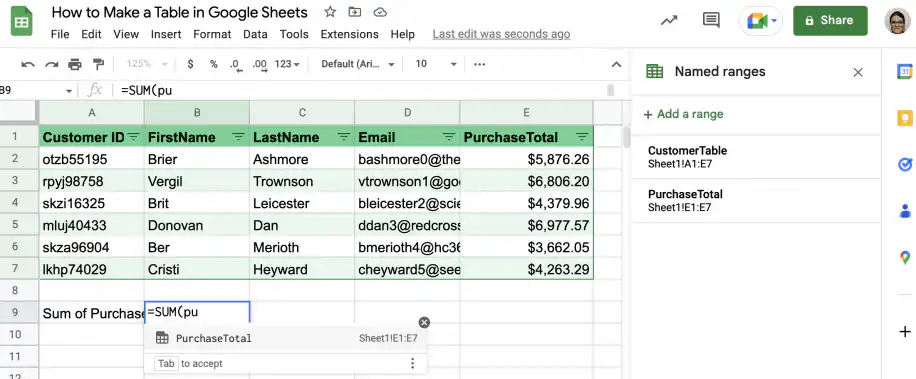
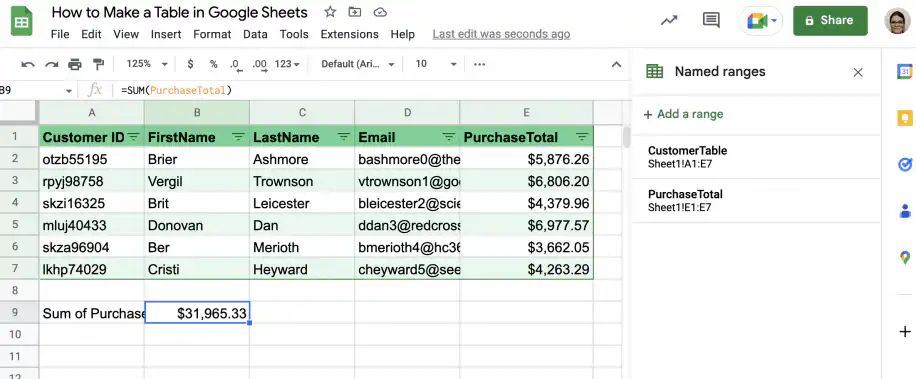
9. Close the parenthesis and press ‘Enter’.
10. That’s it. You have the sum of all purchases.
You can create a table in Google Sheets
And there you have it! This guide showed you five ways to create tables in Google Sheets. You can create and design the table manually or use AI (Gemini) to do it faster. You also saw how to group rows and columns so a long table can collapse, and how to give a table and its columns names you can use in formulas.
You can also check out the following guides to make better Google Sheets tables.
 English
 Español
 Português do Brasil
 Français