



If you’re starting a business or expanding an existing one, you need to know how to perform a break-even analysis before you make a decision. A break-even analysis helps you determine when a new business, product, or service will become profitable. In other words, you can decide whether it’s worth starting the new project.
In this article, you will learn about break-even analysis, when it’s useful, and the limitations of this method. You will also learn how to calculate the break-even point (BEP) and how to use Google Sheets for break-even analysis through examples. If you’d like to learn more about financial analysis, check out our related article on cost-volume-profit analysis: CVP formula and examples.
What is break-even analysis?
As the name suggests, this type of analysis is used to determine when you will break even – in other words, when you’ve covered all your costs. The break-even point (BEP) refers to the moment when you neither lose nor make money: your revenue equals your total costs.
This is an important financial concept, particularly if you’re starting a new business or considering expanding your current business. Using this method, you can figure out how many units of a new product you need to sell or how much profit a new channel needs to make to reach the break-even point.
Break-even analysis can help you make smarter pricing decisions, set specific sales objectives, and keep track of all costs, including fixed ones. Additionally, including this analysis in the proposal will add credibility to your business plan, which can help you get funding.
Break-even analysis limitations
However, there are some limitations to this method that you need to keep in mind. The model is very simplistic in terms of the variables considered, which are completely static. In other words, there’s no accounting for real-life circumstances, like having multiple products with different prices and costs. Additionally, the model assumes that one variable can change at a time, so you’ll probably need to run multiple scenarios with a what-if analysis.
Since this method doesn’t consider the effects of demand, competitors, or time, it’s important to remember that it’s only an estimate. In the next section, you will learn about the formula and how to adjust it for different situations.
What is the break-even analysis formula?
If you want to know how many units you need to sell to break even, use this formula:
break-even_quantity = fixed_costs / (price_per_unit – variable_cost_per_unit)
If you’d prefer your answer in dollars, use this formula instead:
break_even_in_dollars = fixed_costs / contribution_margin_ratio
To use the formula above, you’ll need to calculate the contribution margin ratio with this formula:
contribution margin ratio = (unit_price – variable_cost_per_unit) / unit_price
How to calculate the break-even point?
There are three main components to break-even analysis:
- Fixed costs
- Variable costs
- Average price
It’s very important to ensure that all costs are taken into account, both fixed and variable. However, it is also easy to forget about some of the fixed costs, especially if they don’t contribute to the product in an obvious way.
1. Add up all your fixed costs and ensure you’re not overlooking any expenses.
2. Add up all of your variable costs per unit.
3. Determine the average price for the product.
4. Use the formula with the values from the previous steps.
If you don’t know your variable cost per unit yet, see how to calculate variable cost.
Break-even analysis examples
Follow the instructions below to calculate the break-even point for new product sales. I will use Google Sheets for the examples below, but you can easily do the same in Excel.
How to calculate the break-even point for sales in units?
Imagine you’re thinking of selling a new product. Fixed costs are $200, and it costs you $4.99 to make a single unit, which you will sell for $9.99.
1. Add the fixed costs, variable costs, and price to your spreadsheet.

2. In a separate cell, add the formula using the cell references from the previous step.
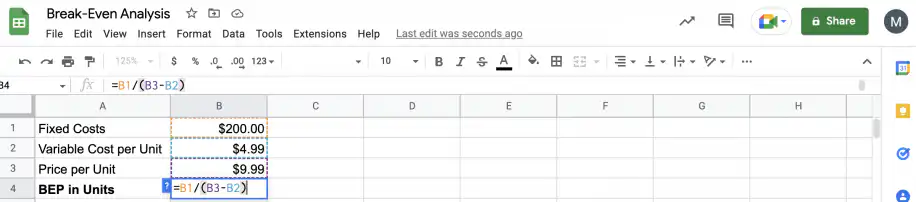
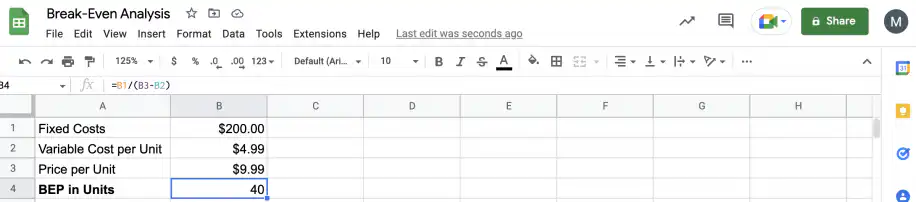
3. That’s it. You need to sell 40 units to break even.
How to calculate the break-even point for sales in dollars?
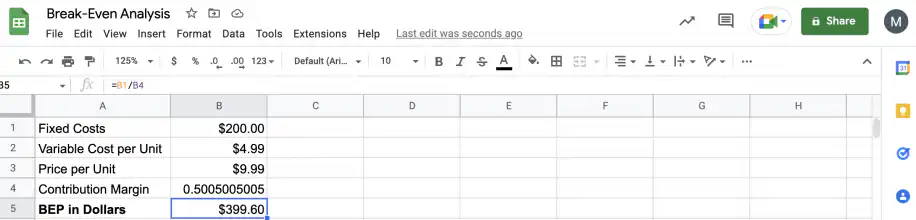
If you want your answer in dollars instead of units, you need the formula that uses the contribution ratio. I’ll use the same values as in the previous example, so fixed costs are $200, variable cost per unit is $4.99, and sales price per unit is $9.99.
1. Add the fixed costs, variable costs, and price to your spreadsheet.

2. Calculate the contribution margin ratio as shown below.
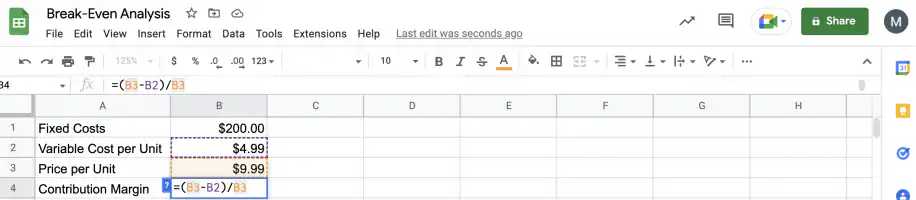
3. In a separate cell, add the formula using cell references to the values obtained in the previous steps.
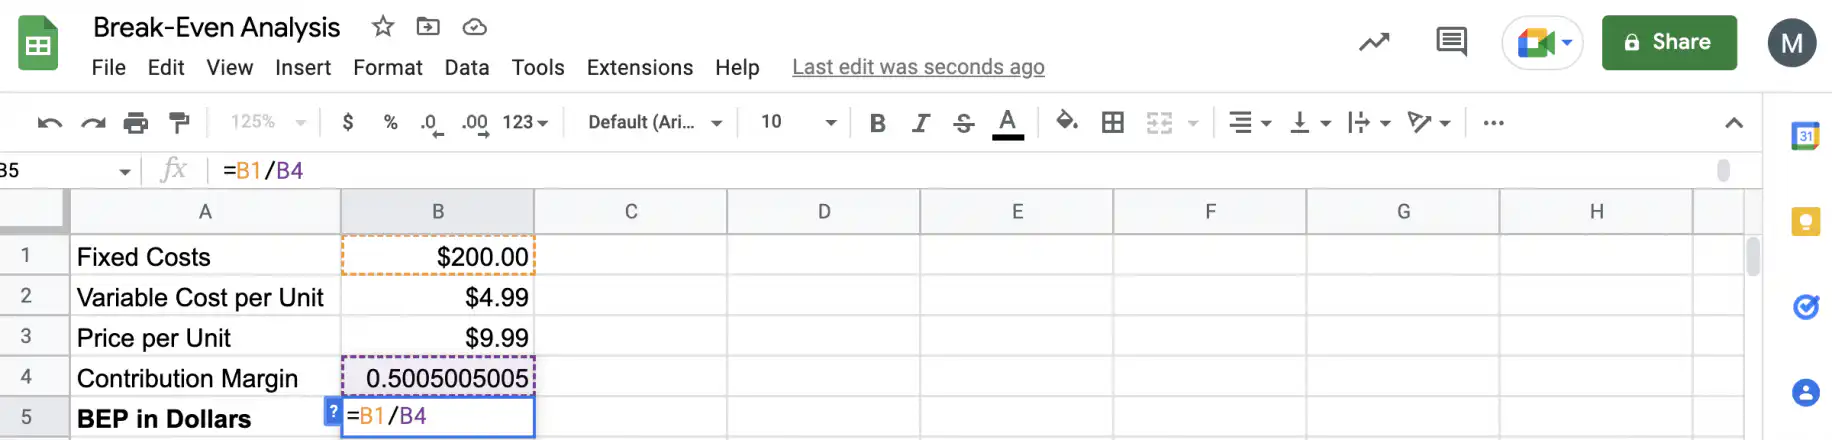
4. That’s it. You need to sell $399.60 to break even.
Conclusion
As you have seen, break-even analysis is a very useful financial planning tool. Whether you’re thinking of starting a business, adding a new product to your mix, or adding a new sales channel, break-even analysis can help you make smarter decisions.
You now know about the benefits and limitations of break-even analysis and how to use the break-even point formula to calculate the BEP in units and in dollars. You also know how to calculate the break-even point in Google Sheets, so you can quickly run through different scenarios by changing the variables.
To find the price you need to break even instead of the number of units, use goal seek in Google Sheets to change the price until profit reaches zero. Your fixed and variable costs usually come from your income statement, so keep it current before you run the numbers. If your finance team tracks costs and sales in spreadsheets, Sheetgo’s AI finance virtual employee can take on much of that routine work.


 English
 Español
 Português do Brasil
 Français