




Cost volume profit analysis is a financial planning tool frequently used to assess the viability of short-term strategies. Among other things, break-even and what-if analyses are carried out for a variety of scenarios to estimate the effects on profits of short-term changes in cost, volume, and selling price.
In this article, you will learn about CVP analysis and its components, as well as the assumptions and limitations of this method. Additionally, you will learn how to carry out this type of analysis in Google Sheets, so you can easily repeat it periodically. With Sheetgo, an AI-powered data automation platform, you can connect your data across multiple locations and formats, and the whole team will have access to updated information.
What is a cost volume profit analysis?
Cost Volume Profit (CVP) analysis is used in cost accounting to determine how a company’s profits are affected by changes in sales volume, fixed costs, and variable costs. Various techniques are involved, including the calculation of the contribution margin and the contribution margin ratio, the break-even point, the margin of safety, and what-if analysis.
Why is a cost volume profit analysis important?
Cost volume profit analysis can be used to justify embarking on manufacturing a new product or providing a new service. By analyzing fixed and variable costs separately, CVP analysis provides insight into the profitability of different products and services, allowing you to make smarter decisions.
You can analyze different scenarios to determine how much you would need to sell in order to break even or reach a certain profit margin. You can also calculate your margin of safety to determine how far your sales can drop and you still break even.
How to perform a cost volume profit analysis?
There are three main components to CVP analysis: cost, sales volume, and price. There are also multiple techniques involved in CVP analysis, allowing you to evaluate as many or as few scenarios as you need. Generally speaking, the CVP formula is the following: profit = revenue – costs.
1. Contribution margin and ratio
The contribution margin ratio and the variable expense ratio can help you evaluate your company’s profitability with respect to variable expenses. The contribution margin can be calculated to get a total dollar amount or an amount per unit. To get a total dollar amount, subtract the total variable costs from the total sales amount.
Contribution margin = Total sales amount – Total variable costs
The contribution margin per unit is calculated by subtracting the variable cost per unit from the selling price per unit.
Contribution margin = Unit selling price – Unit variable costs
To obtain the contribution margin ratio, simply divide by total sales and selling price, respectively.
2. Break-even point
The break-even point (BEP) refers to the moment when you neither lose nor make money: your total revenue equals your total costs. This tells you how much you need to sell to ensure your profits cover your costs. The break-even point can be calculated in units or in dollars. To learn more about break-even analysis and how to calculate the break-even point, check out our article on Break-Even Analysis.
3. Margin of safety
The margin of safety shows you how much your sales can drop while still allowing your company to break even. To find the margin of safety, simply subtract the break-even amount for sales from the actual sales for your company.
Margin of safety = Actual sales amount – Break-even sales amount
You can express this as a percentage by dividing it by the actual sales amount.
4. What-if analysis
You can evaluate different strategies using what-if analysis and setting a profit target. This will allow you to estimate how this affects the other variables involved, such as sales price or quantity produced. To learn about what-if analysis, as well as how to do it in Google Sheets, check out our related article on how to perform what-if analysis in Google Sheets.
5. Automate the process
Financial analyses tend to require input from multiple sources, often in different formats, and need to be repeated regularly. Moreover, the results of many calculations are then used in other analyses, making data management and data synchronization key issues.
Using a tool like Google Sheets or Excel together with Sheetgo, an AI-powered data automation platform, can make your life much easier. Quickly connect your data sources and set up automatic updates to ensure updated data for your whole team.
Cost volume profit analysis assumptions
When carrying out CVP analysis, it’s important to remember that it makes certain key assumptions that don’t necessarily reflect reality, at least in the long term.
For example, both the fixed cost per unit and the variable cost per unit are considered to be constant, and so is the sales price. While this may or may not be true in the short term, it’s very unlikely to remain true for longer timespans. For this reason, this analysis is more effective when evaluating short-term decisions.
Example of cost volume profit analysis
Below, you have step-by-step instructions on how to perform CVP analysis in Google Sheets. By the end, you will have a simple CVP analysis formula sheet that you can reuse every period.
Step 1: Set up data
In Google Sheets, set up the data you need for the CVP analysis: total sales and selling price, total variable and fixed costs, as well as variable and fixed costs per unit.
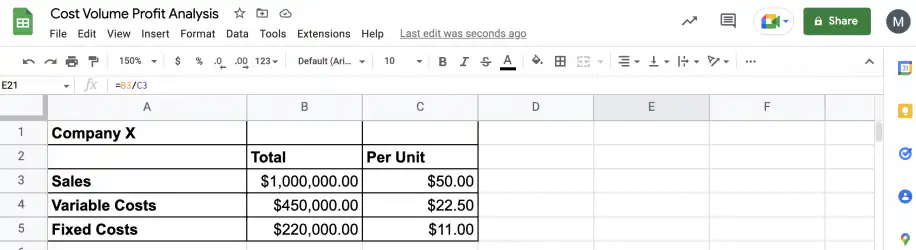
Step 2: Calculate contribution margin
Follow the instructions to calculate the total contribution margin and the contribution margin per unit.
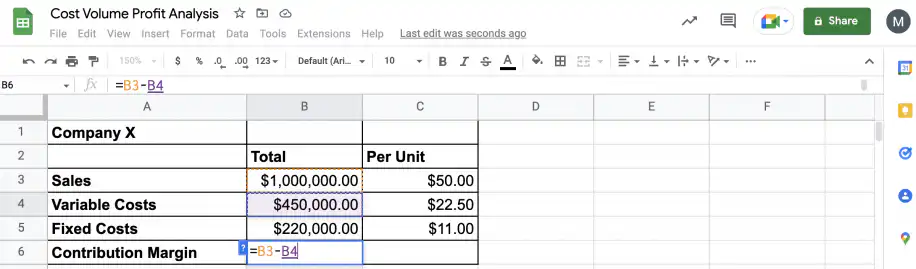
1. Subtract variable costs from sales to get the contribution margin as a total dollar amount.
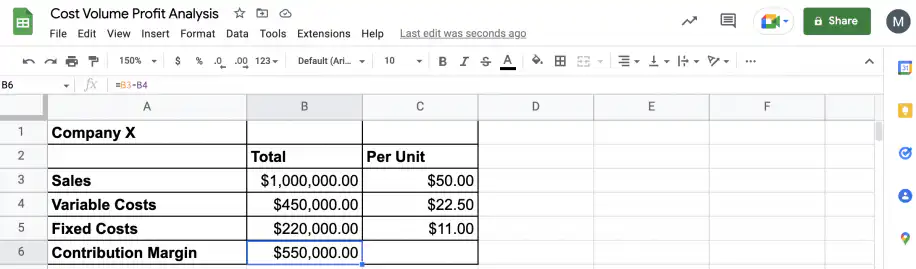
2. The contribution margin is $550,000.00.
3. Subtract the variable cost per unit from the sales price to get the contribution margin per unit.
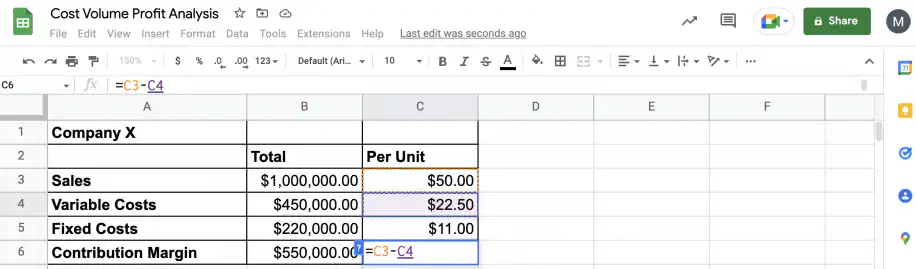
4. The contribution margin per unit is $27.50.
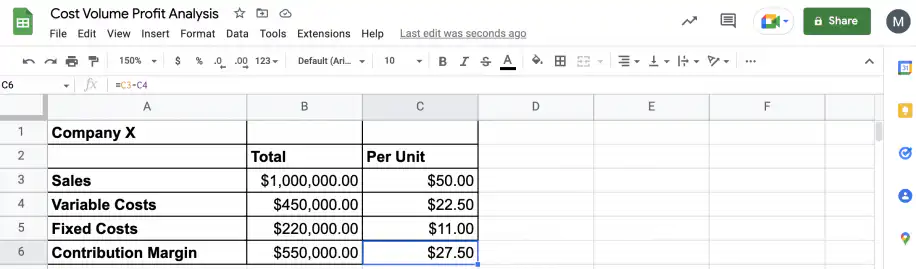
5. Divide the contribution margin by the sales amount to get the ratio.
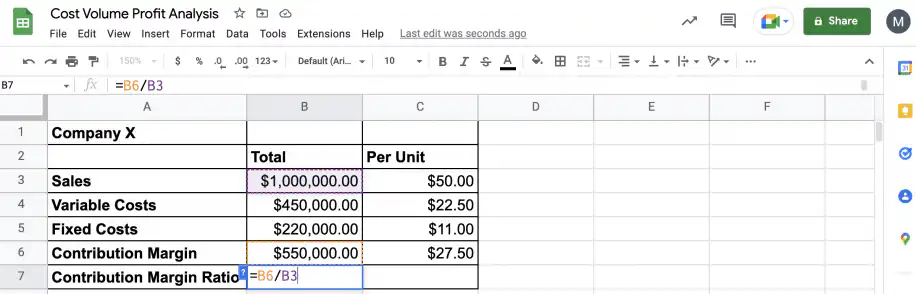
6. The contribution margin ratio is 55%.
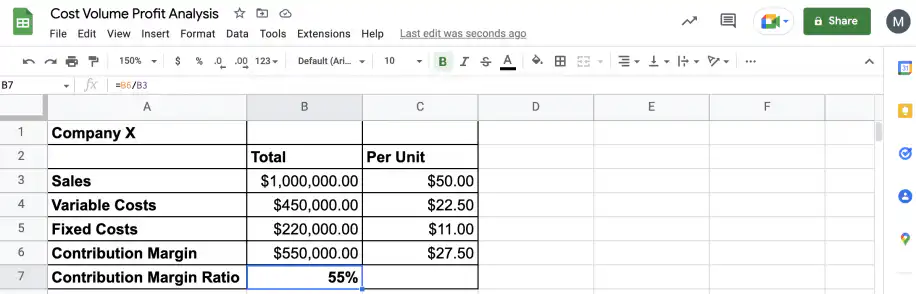
Step 3: Calculate break-even point
You can calculate the break-even point in units or in dollars.
1. Divide the fixed costs by the contribution margin per unit.
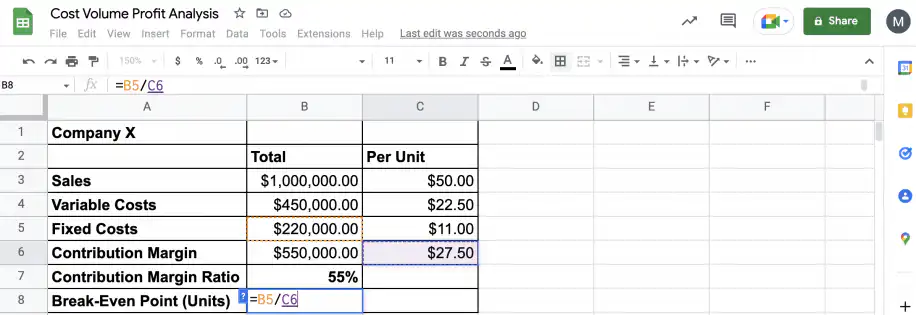
2. You need to sell 8,000 units to break even.
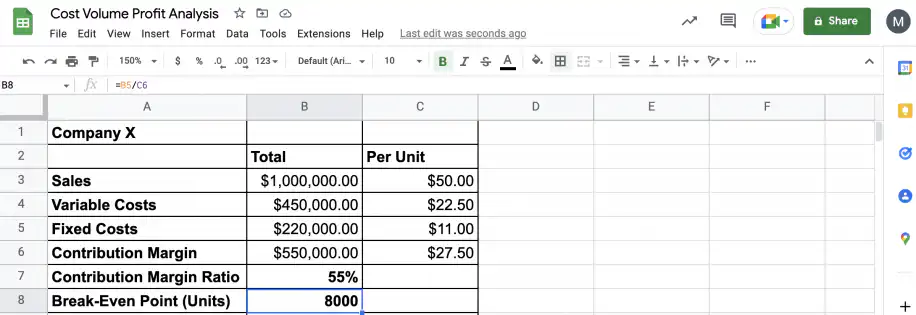
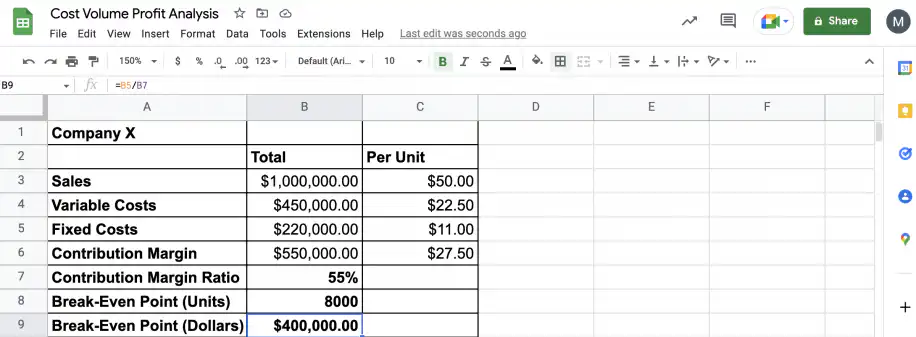
3. To get the answer in dollars, divide fixed costs by the contribution margin ratio.
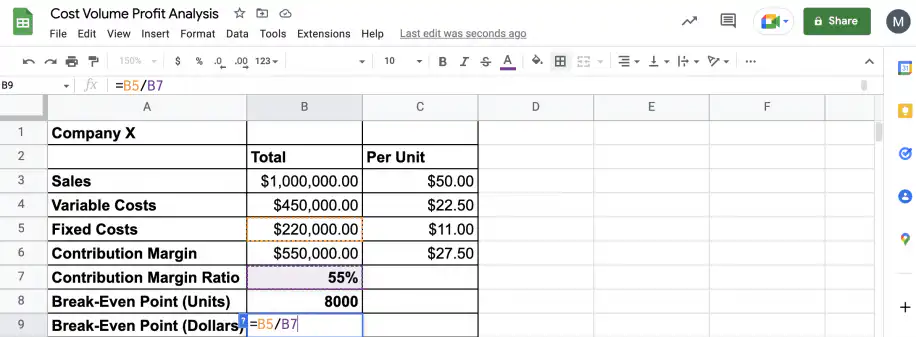
4. You need to make $400,000 in sales to break even.
Step 4: Calculate the margin of safety
Finally, you can calculate the margin of safety – in dollars or as a percentage of sales – to calculate how much sales could drop while still breaking even.
1. Subtract the break-even amount from the sales amount.
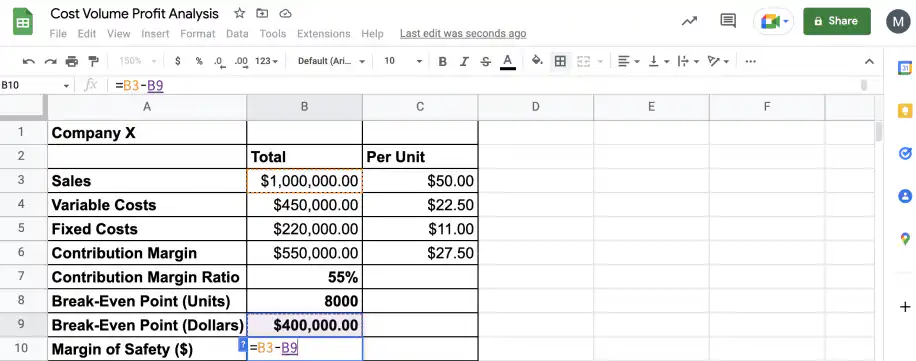
2. The margin of safety is $600,000.
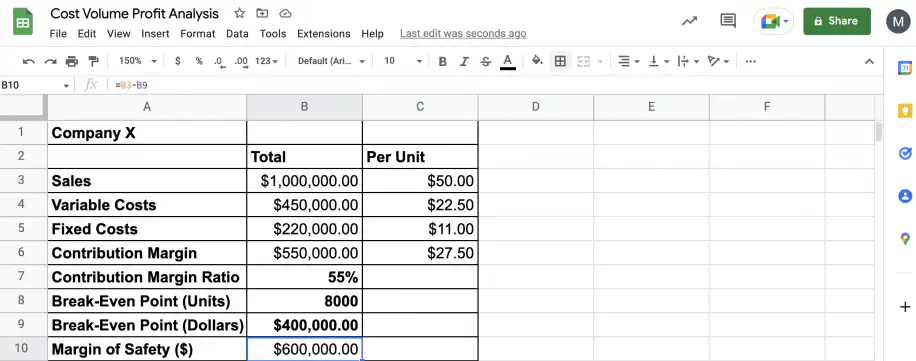
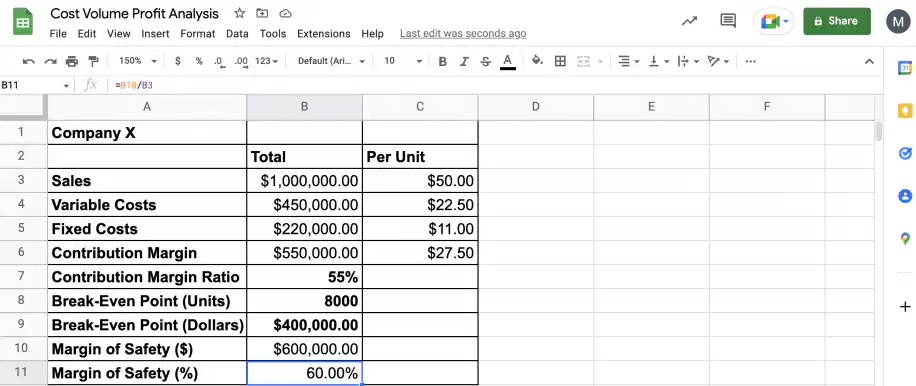
3. Divide the margin of safety by the sales amount to get a percentage.
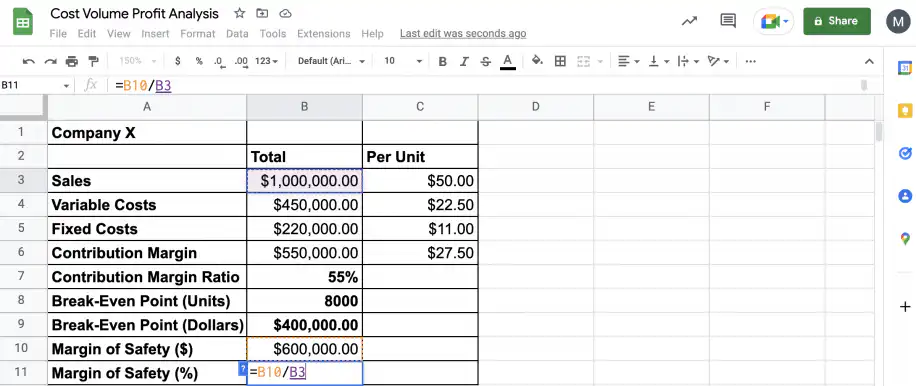
4. There is a 60% margin of safety for sales.
Limitations of cost volume profit analysis
There are some limitations related to CVP analysis that you need to keep in mind. This type of analysis relies on a clear distinction being made between fixed and variable costs. However, this is not always straightforward in reality, as not all costs remain neatly in their categories over time.
Semi-variable or semi-fixed costs are particularly tricky to break down, as the proportion of fixed and variable costs can also change. There are several methods that you can use for semi-variable costs, like the high-low method or statistical regression (for example, linear regression in Google Sheets).
Finally, remember that the method assumes that all units made are going to be sold. Unfortunately, this is not something that can be guaranteed in reality and will depend on external factors, including supply, demand, and competitor strategies.
Conclusion
As you have seen, cost volume profit analysis can help you improve your company’s performance by allowing you to evaluate the potential effects on profitability if you were to add a new product or service. This kind of analysis relies on various key metrics related to costs. To learn more about this, check out our related articles on Break-Even Analysis, How To Find Variable Cost, and How To Find Fixed Cost.
Once your CVP figures are in place, you can compare your plan with actual results through budget variance analysis, project future sales with revenue forecasting, and track the underlying costs in a profit and loss statement template.
You now know about CVP analysis and its components, as well as the assumptions and limitations of this method. You also know how to use Google Sheets to carry out your own CVP analysis. Performing this type of analysis usually requires data from multiple sources and the involvement of multiple people. Sheetgo’s AI finance virtual employee can gather those figures from your spreadsheets and keep your CVP calculations up to date.


 English
 Español
 Português do Brasil
 Français