




The z-score is a very useful metric in probability and statistics. Since they express the distance of a specific value from the mean in standard deviations, z-scores can be used for multiple purposes.
Z-scores are fundamental in hypothesis testing to determine whether values fall within an acceptable range. Z-scores are also frequently used to standardize data before analysis, allowing you to compare values from different normal distributions and calculate the probability of specific values.
In this guide, you will learn all about z-scores: what they are, and the formula used to calculate them. First, you will learn to calculate the z-score manually, given the population mean and standard deviation.
You will also learn how to do the same thing in Google Sheets. After that, you will learn how to find the z-scores when you have all the values by first calculating the mean and the standard deviation. Finally, you will learn how to interpret z-scores and what you can use them for.
What is a Z-score?
Z-scores, which are sometimes referred to as standard scores, measure the distance between specific values – raw scores – and the mean of the dataset. The z-score’s unit of measure is the dataset’s standard deviation, and the sign indicates whether the value is above or below the mean.
Z-score formula
There are three variables to consider when calculating a z-score: the raw score (x), the population mean (μ), and the population standard deviation (σ). To get the z-score, subtract the population mean from the raw score and divide the result by the population standard deviation.
z-score = (x – μ) / σ
How to calculate the Z-score?
There are three steps involved in calculating the z-score: find the population mean, find the population standard deviation, and apply the z-score formula. In this section, you will learn how to calculate z-scores manually and using Google Sheets.
How to calculate the Z-score manually?
Imagine you’ve been given three test scores and some information about the test. You know the average score (71.73) and the standard deviation (15.83). The test scores that need to be standardized – converted to z-scores – are as follows:
- Score1 = 94
- Score2 = 70
- Score3 = 23
To find the z-score for each test score, you’ll need to use the z-score formula, knowing that μ = 71.73 and σ = 15.83.
- z-score1 = (x – μ) / σ = (94 – 71.73) / 15.83 = 1.41
- z-score2 = (x – μ) / σ = (70 – 71.73) / 15.83 = -0.11
- z-score3 = (x – μ) / σ = (23 – 71.73) / 15.83 = -3.08
As you can see, the second score is closest to the mean, while the third is a full three standard deviations below the mean.
How to calculate the Z-score with Google Sheets?
Now that you know how to calculate z-scores manually, let’s see how easy it is to do it in Google Sheets.
- In the first example, you have the mean and standard deviation for the population, and you need to calculate the z-score for three specific values.
- In the second example, you have the entire set of values, so you’ll have to calculate the mean and standard deviation before calculating the z-scores.
How to calculate the Z-score: example #1
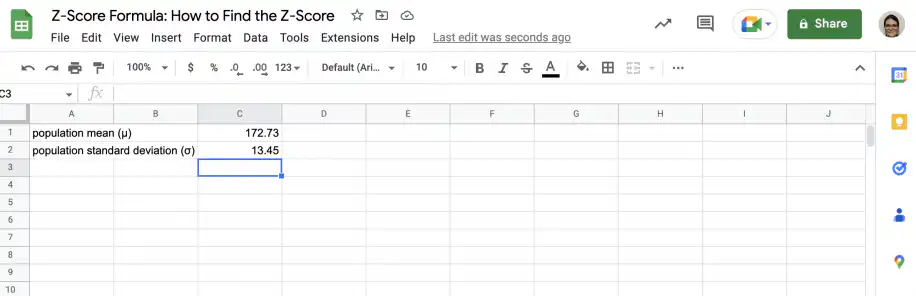
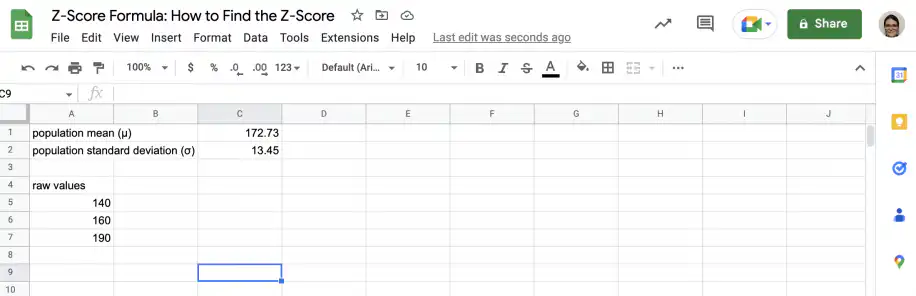
Follow the steps below to calculate the z-scores of 3 values (140, 160, 190), given a population mean of 172.73 and a standard deviation of 13.45.
1. Open Google Sheets and type the mean and standard deviation in separate cells.
2. In separate cells, type in the three values you want to standardize.
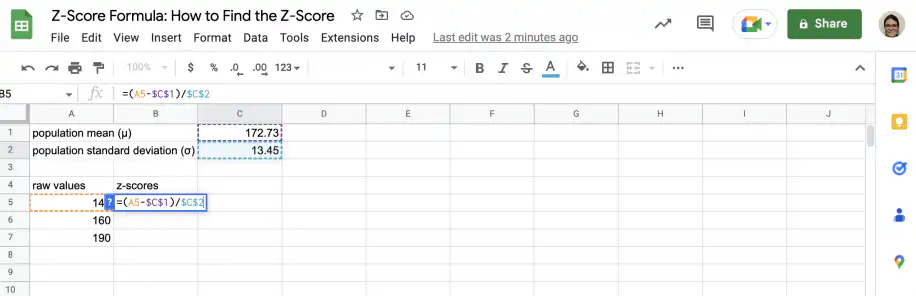
3. In the cell next to the first value, type in the z-score formula as shown below. Use absolute referencing for the cells with the mean and standard deviation so that you can copy the formula down to the other two values.
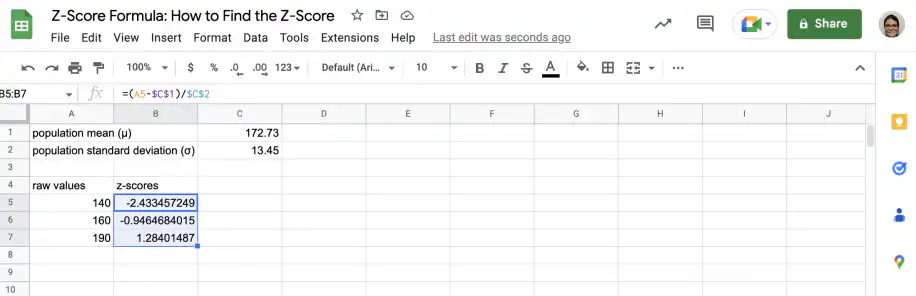
4. Grab the fill handle and drag it down to the last value. As you can see, the second value is closest to the mean: just under one standard deviation away from it. The first score is the furthest, as it is almost two and a half standard deviations below the mean.
How to calculate the Z-score: example #2
For this example, you have access to the test scores for a class of 48. Therefore, you can calculate the mean and standard deviation yourself and work out the z-scores for every value.
1. Open Google Sheets to the spreadsheet with your dataset.
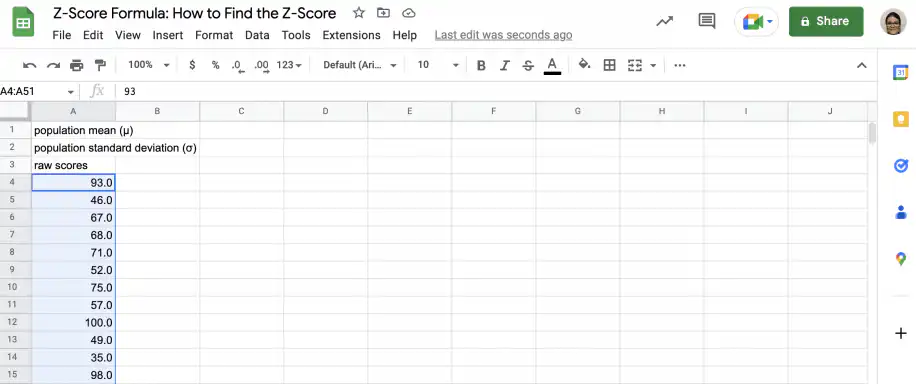
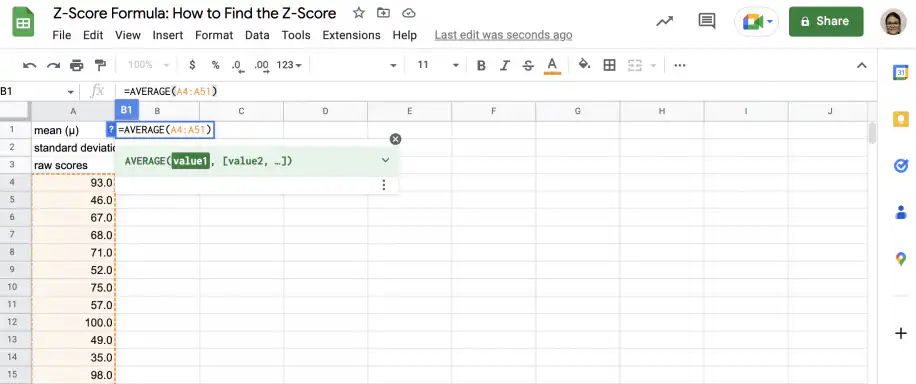
2. To find the population mean, type in the AVERAGE function and select the entire range of values.
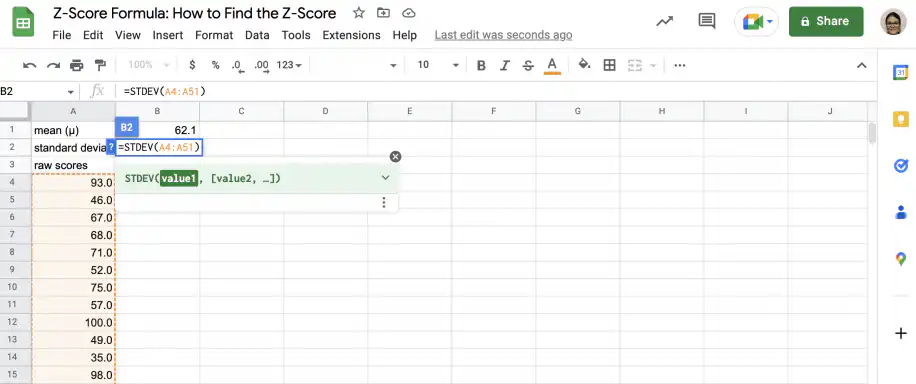
3. To find the standard deviation, use the STDEV function on the whole range of values. STDEV treats the data as a sample. If the scores are the whole population, STDEV.P returns the population standard deviation.
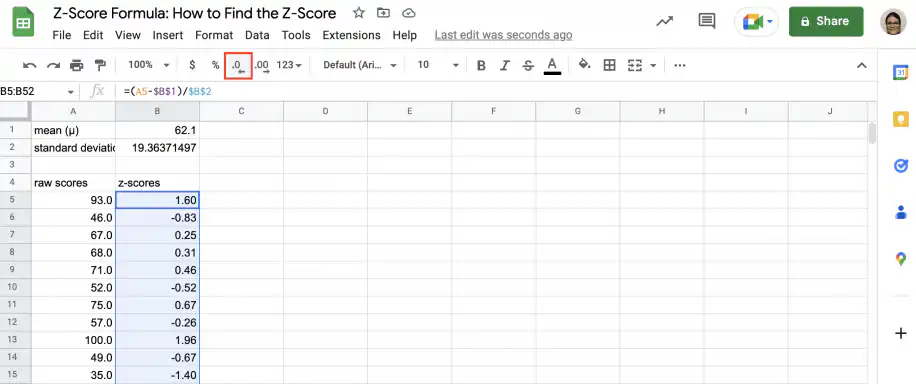
4. In the empty cell next to the first raw score, type in the z-score formula. Remember to use absolute referencing for the mean and standard deviation so that you can copy the formula down.
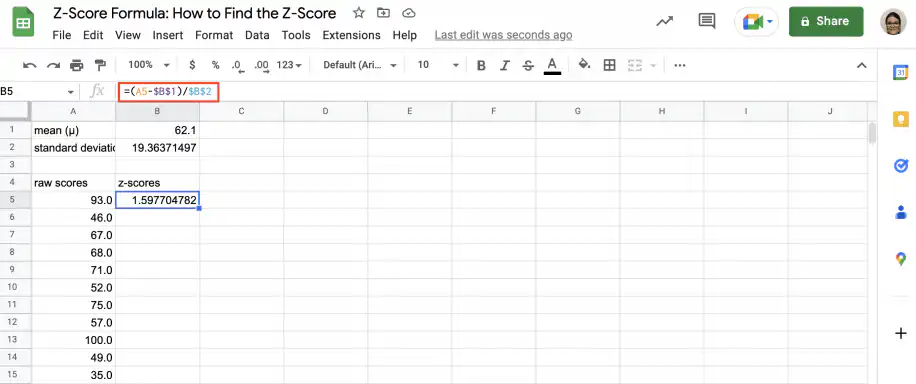
5. Grab the fill handle and drag it down to the last value. You have the z-score of every value in the set. If you prefer to see the values more clearly, click the Decrease decimal places button in the toolbar to show fewer decimals.
How to interpret the Z-score?
Z-scores measure how far a specific value lies from the population mean. Since this distance is measured using the population standard deviation, if the z-score is 0, your value is equal to the mean. If the z-score is negative, your value is below the mean. If it’s positive, it’s above the mean.
What is the Z-score used for?
Z-scores are useful in any field that relies on probability and statistics, such as finance, medicine, academic performance, or quantitative research in general. Whether you’re working with data related to stock metrics, medical trials, or exam scores, z-scores tell you where specific observations fit in the distribution of your dataset.
You may want to calculate the z-scores of your raw data for many reasons. It helps you understand where specific data points fit in a distribution, identify outliers, and compare different variables. Additionally, you can use the z-scores to calculate probabilities and percentiles with the standard normal distribution. While it’s possible to calculate them, you shouldn’t rely on z-scores if the population you took the sample from doesn’t follow a normal distribution.
Conclusion
As you have seen, z-scores or standard scores are very helpful statistical measures. Using the population mean and standard deviation, you can find the z-score for any data point. By standardizing your raw data, you can compare data points from different variables, identify outliers, and calculate the probabilities and percentiles of specific values.
You now know what the z-score is, the formula used to calculate it, and what it can be used for. You have step-by-step instructions on how to calculate z-scores manually and how to calculate them using Google Sheets. In the first example, you saw how to calculate z-scores for specific values when you know the population mean and standard deviation. In the second example, you saw how to calculate z-scores using the AVERAGE and STDEV functions in Google Sheets when you have all the values in the set.
To go the other way and turn a probability back into a z-score, use the NORMSINV formula. If your scores or measurements come from several spreadsheets, Sheetgo, an AI-powered data automation platform, can combine them into one sheet and keep it updated, so your z-scores always use current data.

 English
 Español
 Português do Brasil
 Français