




Running a successful business is tough in any industry, and Software as a Service (SaaS) is no exception. As we become increasingly dependent on technology, demand for these services grows, and so does supply. Competition is fierce, and both customers and investors have access to more information than ever before.
So how can you evaluate how well your SaaS business is doing? Equally important, how are others evaluating the success of your SaaS business? While you can use many financial metrics, the Rule of 40 is a popular SaaS value metric. Initially introduced by venture capitalists, the Rule of 40 considers both growth and profitability, which provides a more balanced view of the company’s performance.
In this guide, you will learn about the rule of 40: what it means and why it matters. You will also learn how to calculate it and how monitoring this metric can help your SaaS business. Finally, you have some examples to see how the Rule of 40 is applied.
What is the Rule of 40?
The Rule of 40 applies to the combined value of the revenue growth rate and the profit margin. It states that the sum of these values should equal at least 40%. This is considered to be the benchmark for sustainable growth, and values below 40% can indicate liquidity issues.
Why does the Rule of 40 matter?
The Rule of 40 promotes a balance between growth and profitability. Applying this principle to your SaaS business will help you with short-term and long-term strategy and planning. Values above 40% are likely to attract potential investors and help ensure sustainable growth for your business.
A strategy focusing exclusively on revenue growth can result in sacrificing profits, while one focusing purely on profitability can result in sacrificing growth. The Rule of 40, however, promotes a balance between the two that favors sustainable growth for your business.
To see how fast a company can grow without new debt or equity, read our guide to the sustainable growth rate.
How to calculate the Rule of 40?
To calculate whether your SaaS business adheres to the Rule of 40, you need to add the revenue growth rate to the profit margin. In other words, you first need to calculate these two metrics.
Growth rate
The Generally Accepted Accounting Principles (GAAP) provide a clear definition of revenue, so calculating your year-over-year revenue growth is a straightforward process. However, if your business is still in the early stages, you may focus more on Annual Recurring Revenue or Monthly Recurring Revenue.
Profit margin
The profit margin, on the other hand, is a slightly different story. It’s a much broader term, and profitability analysis makes use of many different metrics, including gross, net, and operating profit, as well as Earnings Before Interest, Taxes, Depreciation & Amortization (EBITDA). The calculation of these metrics relies on different items on your financial statements, so some of these metrics are more likely than others to yield favorable results for your company.
While there is no single right choice regarding the profit margin, the EBITDA margin is a popular choice due to its comparability across companies. However, as with any kind of financial analysis, it isn’t wise to rely on a single method or metric, as the results can vary significantly. Using different metrics to calculate the profitability margin can also help you identify favorable and unfavorable aspects of your business.
Rule of 40 examples in Google Sheets
For the sake of simplicity, the examples below use year-over-year revenue to express the growth rate and the EBITDA margin to express profitability.
Let’s apply the Rule of 40 to two different companies to see how it works.
Calculate growth rate
First, you need to calculate the revenue growth rate for both companies using the formula for Year-Over-Year (YOY) growth. The formula uses “new” and “old” values for revenue, taken a year apart, to show the annual growth rate.
YOY growth = ((new value – old value) / old value) * 100
For more information and examples of how to use this formula, check out this guide on How to Calculate Year-Over-Year Growth.
1. In Google Sheets, gather the required data for both companies.

Rule of 40: Definition, Formula, & Calculation – Gather Revenue Growth Data
2. In the cell where you want the result, type in the equal sign and add the cells as shown below. First, subtract the old revenue value from the new one and divide the result by the old value. Finally, multiply the result by 100.

Rule of 40: Definition, Formula, & Calculation – Add YOY Growth Formula
3. You can copy the formula down to Company B by grabbing the fill handle and dragging it to the cell below.
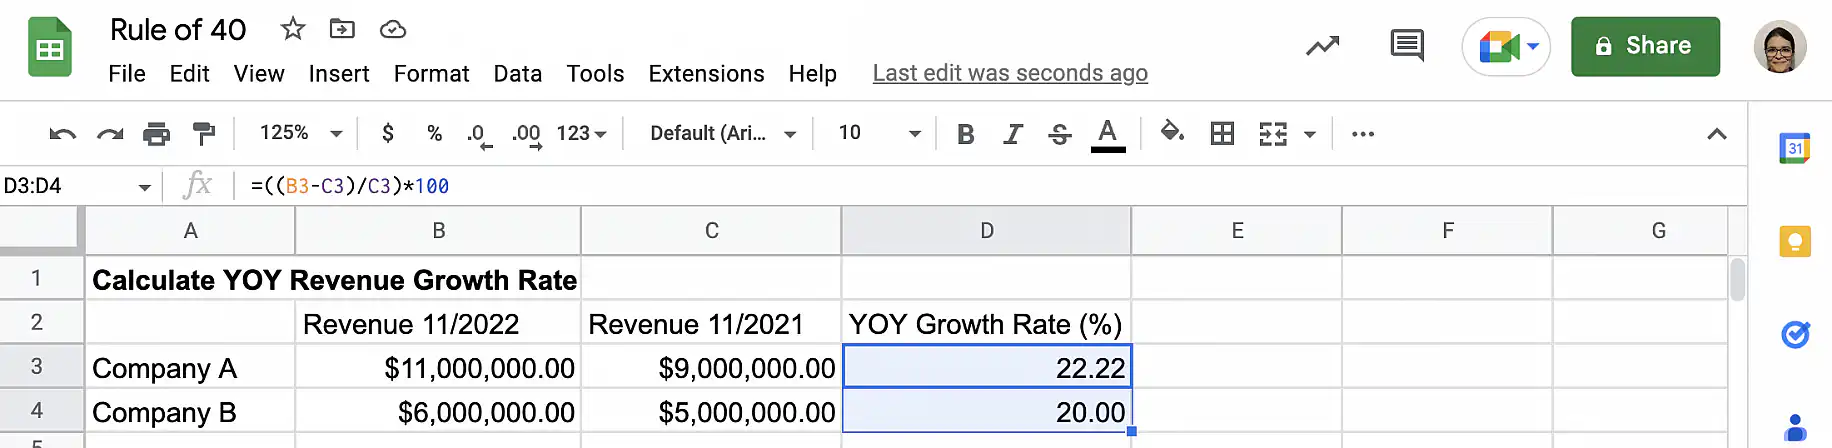
Rule of 40: Definition, Formula, & Calculation – Drag Formula Down
4. That’s it. You have the growth rates for both companies.

Rule of 40: Definition, Formula, & Calculation – Revenue Growth Rate
Calculate EBITDA margin
Now that you have the growth rates, you need to calculate the EBITDA margins by dividing the value of EBITDA by the value of revenue.
EBITDA margin = EBITDA / revenue
To learn more about EBITDA and related metrics, take a look at this post on How to Calculate EBITDA.
1. In Google Sheets, gather the required data for both companies.

Rule of 40: Definition, Formula, & Calculation – Gather EBITDA Margin Data
2. Type the equal sign to add the formula in the cell where you want the results. Select the cell with the value of EBITDA and divide by the cell containing the value for revenue.
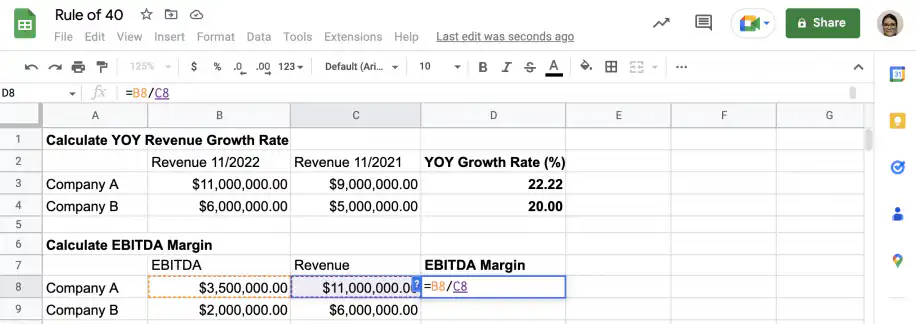
Rule of 40: Definition, Formula, & Calculation – Add EBITDA Margin Formula
3. You can copy the formula down to Company B by grabbing the fill handle and dragging it to the cell below.
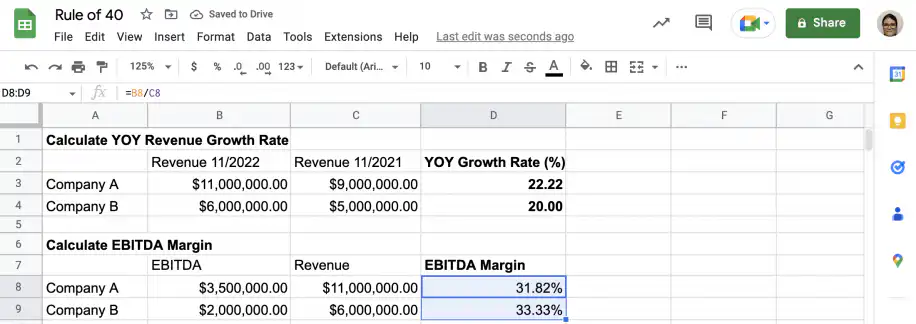
Rule of 40: Definition, Formula, & Calculation – Drag Formula Down
4. That’s it. You have the profit margin for both companies.
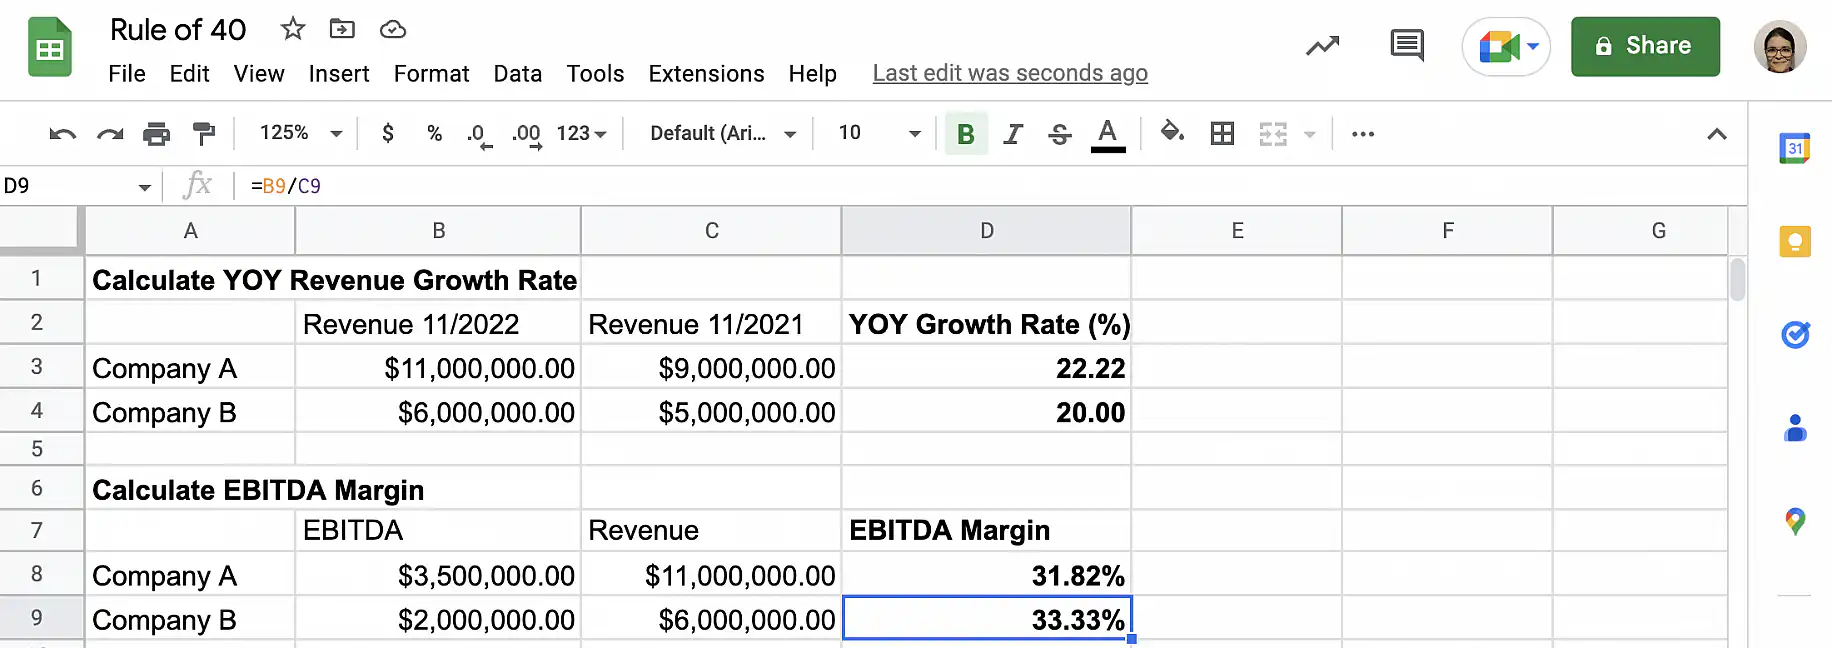
Rule of 40: Definition, Formula, & Calculation – EBITDA Margins
Add growth & profit
To calculate the Rule of 40 value, simply add the growth rate and profit margin for each company.
1. Type in the equal sign and add the growth rate and EBITDA margin values for Company A.
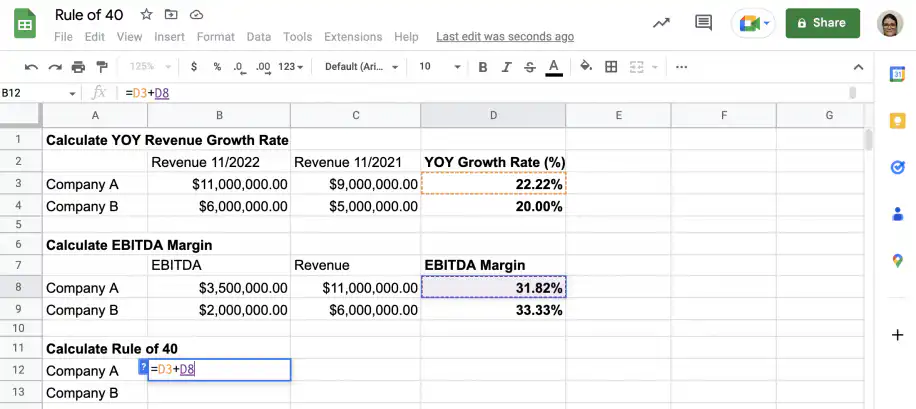
Rule of 40: Definition, Formula, & Calculation – Add Rule of 40 Formula
2. Grab the fill handle and drag it down to copy the formula for Company B.
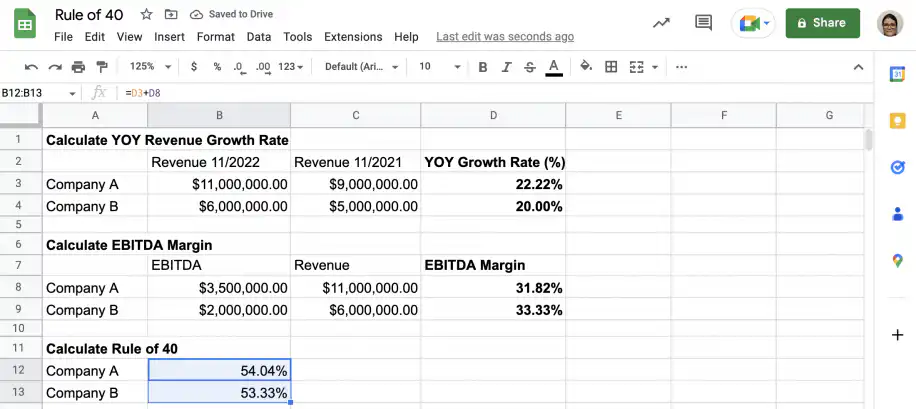
Rule of 40: Definition, Formula, & Calculation – Drag Rule of 40 Formula Down
3. As you can see, both companies have values above 40%, despite the differences in terms of the absolute values for revenue.
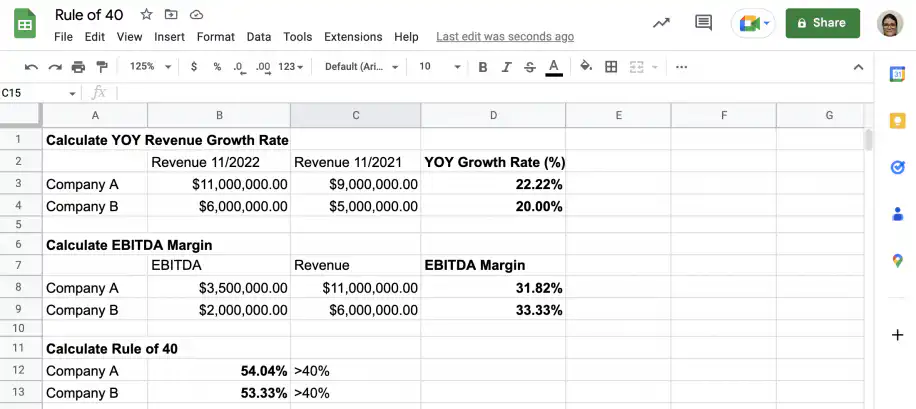
Rule of 40: Definition, Formula, & Calculation – Rule of 40 Values
Conclusion
As you have seen, the Rule of 40 is a useful SaaS value metric and promotes balanced and sustainable growth. Its popularity among investors means it’s a good idea for you to keep this metric in mind, as they certainly will. However, just like any company valuation method, you shouldn’t rely exclusively on it. In fact, different metrics can be used within the Rule of 40 calculations.
You now know what the Rule of 40 is and why it has become one of the most popular SaaS value metrics, particularly among long-term investors. You also know the formula used to obtain this value and how to use Google Sheets to calculate it.
To learn more about the different formulas used in this post, as well as other company valuation methods, check out the ones below.
- Annual recurring revenue (ARR) and how to calculate it
- How to calculate year-over-year (YOY) growth
- How to calculate profit margin in Google Sheets: formula and examples
To compare growth over several years instead of one, see how to calculate CAGR in Google Sheets. And if you plan ahead, our revenue forecasting guide covers the main models. When these numbers come from several spreadsheets, Sheetgo’s AI finance virtual employee can collect the figures and keep your Rule of 40 calculation up to date.


 English
 Español
 Português do Brasil
 Français