




For any company, the initial objective is to break even. However, the main aim is to become profitable as soon as possible. Profit margins are some of the most commonly used metrics in the analysis of a company’s profitability, together with other financial ratios. Since the term profit is rather broad, specific ratios focus on different profit categories.
In this article, you will learn about profit margins and the formulas used to calculate them. You will also learn how to calculate the most commonly used margins using Google Sheets: gross profit margin, operating profit margin, and net profit margin. To learn about other profitability ratios, check out our article on profitability analysis: step-by-step guide.
What is profit margin?
The profit margin is the proportion of revenue that represents profit. Since profit is a rather broad term, there are multiple ratios that focus on different aspects of it. Some use broader interpretations of profit, such as the gross profit margin, and some use more specific ones, such as the net profit margin.
Additionally, you should check what margins are commonly used within your industry. Depending on the industry and business model, you need to consider different types of expenses and liabilities. When calculating these margins, remember to compare them to similar companies in your industry.
What is a good profit margin?
The range of acceptable profit margin values depends on many factors, including industry, company size, and business model. You will see references to general rules of thumb, indicating that 10% is average and 20% is good. However, this is meaningless without identifying competitors and benchmarking your industry.
In addition to their individual values, it’s important to analyze the differences between ratios. For instance, how large is the difference between gross profit and operating profit? If the second is much lower, you may want to look into current operational procedures and identify areas for improvement.
For SaaS companies, the Rule of 40 puts profit margin and revenue growth rate into a single health check.
How to calculate profit margin?
Generally speaking, you can calculate the profit margin by dividing profit by revenue and multiplying by 100. However, depending on the specific margin you want, you can use different formulas to calculate profit: gross, operating, and net profit are the three most commonly used.
How to calculate gross profit margin?
This is probably the most commonly used and broadest measure of profitability. However, it only considers the cost of goods sold. To calculate the gross profit margin, you first need to subtract the value of the cost of goods sold from the value of revenue. Next, divide by the value of revenue and multiply the result by 100.
gross profit margin = ((revenue – COGS) / revenue) * 100
In some industries, using the adjusted gross profit margin is more common, as it also considers inventory carrying costs.
How to calculate operating profit margin?
The operating profit margin, aka the EBIT margin, is more restrictive than the gross profit margin but less than the net profit margin. It expresses the proportion of revenue the company earns from operations before deducting interest and taxes. To calculate it, divide operating profit by revenue and multiply by 100.
operating profit margin = (operating profit / revenue) * 100
How to calculate net profit margin?
The net profit margin, or bottom line, provides an overall picture of profitability after all expenses have been considered, including taxes and interest. The fact that this margin accounts for all costs makes it a comprehensive measure of net profit. However, this also means it will include one-off gains and losses that are not likely to be repeated.
net profit margin = (net income / revenue) * 100
How to calculate profit margin in Excel or Google Sheets?
As you can see, you can calculate these margins using the data available in the company’s financial statements. If you use templates for these statements in Excel or Google Sheets, you can add the profit margin formulas to your templates.
If you don’t currently use templates for your financial statements, you can use these free Balance Sheet and income statement templates. Using templates will allow you to calculate these margins for new data quickly. If you work in a team and use multiple files, you may want to consider Sheetgo’s AI automations. You can connect data from several files and formats and keep track of progress and results.
In the next section, you have examples of the three main profit margin ratios calculated directly using the free Income Statement template.
Profit margin examples
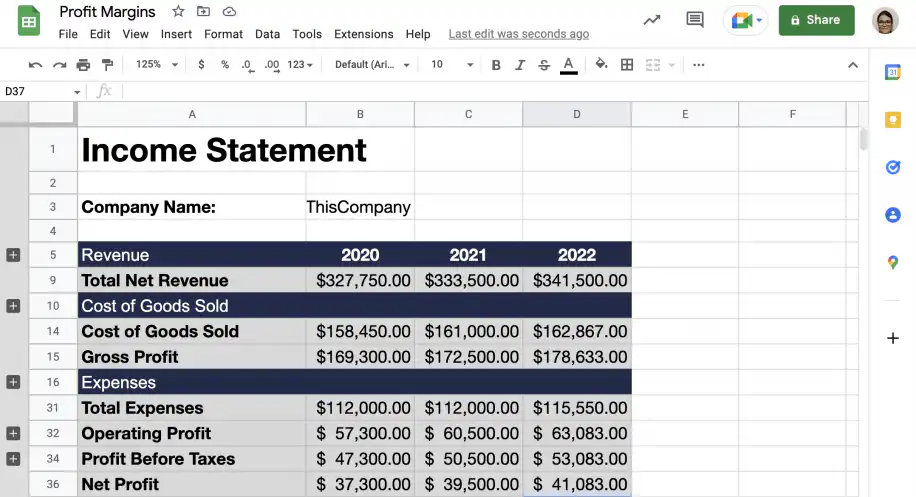
The following examples are based on this free Income Statement template, using data for ThisCompany between 2020 and 2022, as shown below.
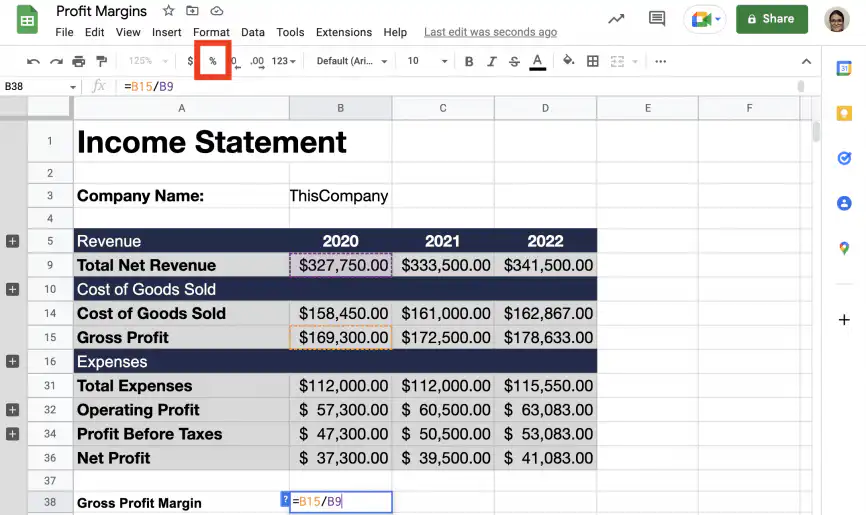
1. Below the data, under the corresponding year, type in the formula for gross profit margin. Divide ‘Gross Profit’ by ‘Total Net Revenue.’ In this template, the formula in cell B38 is =B15/B9. Instead of multiplying by 100, you can simply pre-format the cells as percentages, and Google Sheets will do it automatically. Click the percent format button (%), marked with a red square below.
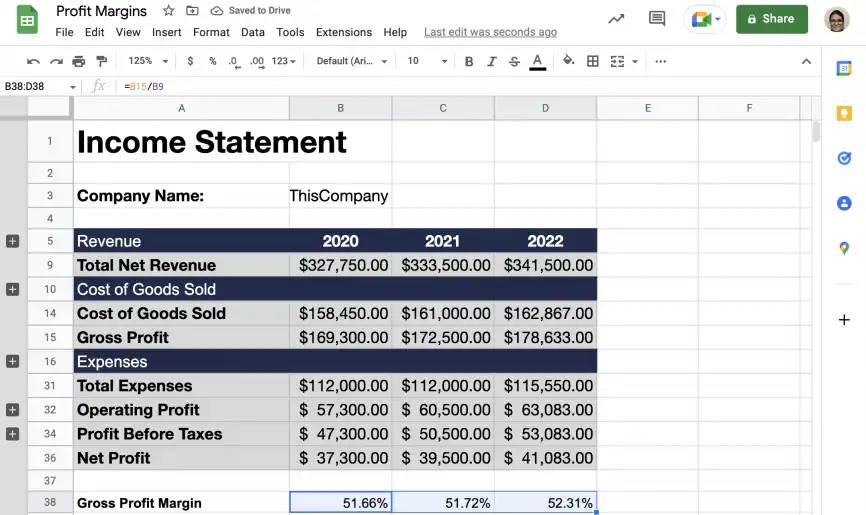
2. Drag the formula to the right to cover as many years as you need.
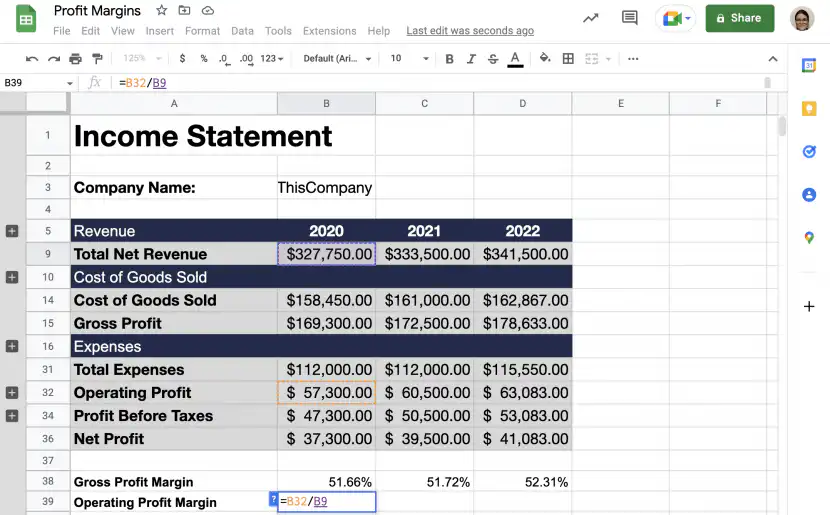
3. Below the ‘Gross Profit Margin’, add the formula for ‘Operating Profit Margin’ below the corresponding year. Divide ‘Operating Profit’ by ‘Total Net Revenue’ and remember to format the cell as a percentage. In this template, the formula in cell B39 is =B32/B9.
4. Drag the formula to the right to calculate the ‘Operating Profit Margin’ for additional years.
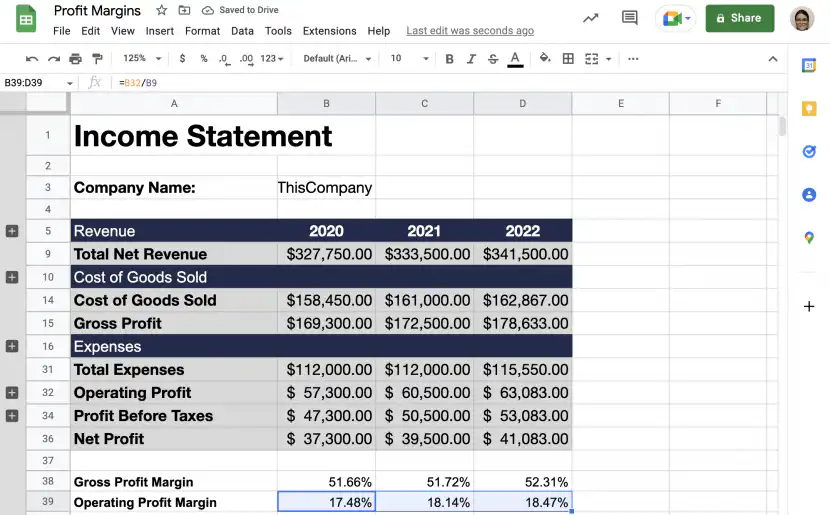
5. Next, type the formula for the ‘Net Profit Margin’ below the corresponding year. Divide ‘Net Profit’ by ‘Total Net Revenue’ and format it as a percentage. In this template, the formula in cell B40 is =B36/B9.
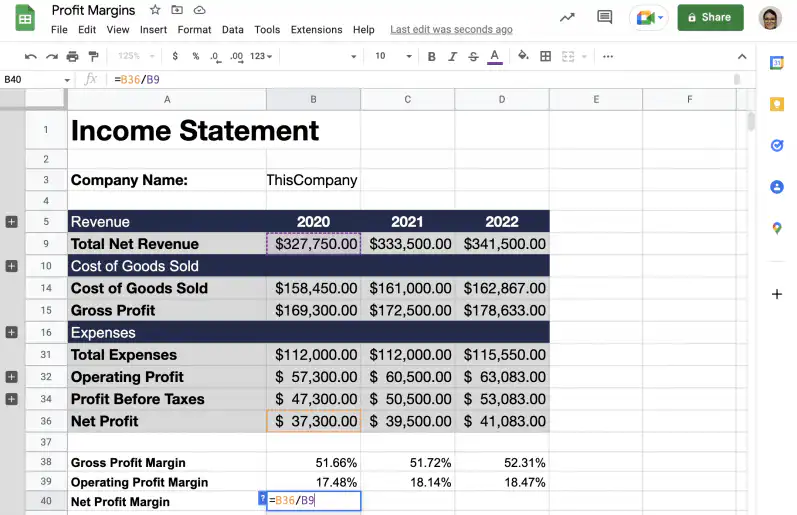
6. Finally, drag the ‘Net Profit Margin’ formula to the right to calculate this margin for the years you want.
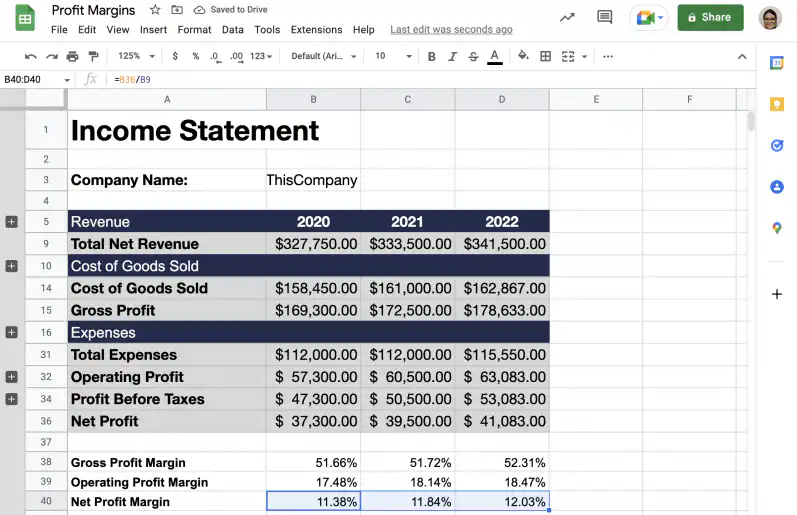
That’s it! You now have the profit margin values for three consecutive years.
Conclusion
As you have seen, profit margins are easy to calculate and can provide valuable insight into a company’s profitability. By comparing the values for different types of profit margins for the same company, you can also get insights into the distribution of costs. Since they are expressed as percentages, it’s also easy to compare with other companies. However, be careful when comparing, as values vary significantly by industry.
You now know about profit margins and how to calculate the three most commonly used. You also know how to add the formulas to your financial statements in Excel or Google Sheets to automate calculations. If those statements are spread across several spreadsheets, Sheetgo’s AI finance virtual employee can collect the figures on a schedule and keep your margin reports up to date.
To learn more about other financial ratios and analyses, check out these articles:


 English
 Español
 Português do Brasil
 Français