




EBITDA stands for Earnings Before Interest, Taxes, Depreciation, and Amortization. It is a popular financial metric used in company valuations and profitability analysis. EBITDA is also used to calculate other metrics and ratios, like the EBITDA margin. In fact, since there are many ways to calculate it, and it’s used in calculating so many other ratios, EBITDA can get confusing very quickly.
In this article, you’ll learn about EBITDA and its importance as a financial metric, as well as how it differs from various related metrics, like EBITDA multiple, EBITDA margin, adjusted EBITDA, and net profit. You will also learn how to calculate EBITDA and how to set up the calculation in Microsoft Excel or Google Sheets.
To learn more about company valuation methods and profitability ratios, take a look at the following articles:
What is EBITDA?
EBITDA stands for Earnings Before Interest, Taxes, Depreciation, and Amortization. The company’s income statement contains all the information you need to calculate it, and you can calculate EBITDA using many variations of the formula. It provides a value that is close to the company’s cash flow, though it is not as exact.
EBITDA, while popular, is not a universally accepted metric. Both regulatory bodies and financial experts have expressed serious misgivings regarding EBITDA, as it provides a very biased view of the company. Since it adds back interest and taxes, as well as the expense associated with depreciation and amortization, it can provide a very distorted view of the company’s finances.
How to calculate EBITDA?
To calculate Earnings Before Interest, Taxes, Depreciation, and Amortization (EBITDA), you will need information from the company’s income statement, but the metric itself is not an item that appears on it. The value of EBITDA is equal to the sum of net income, interest, taxes, depreciation, and amortization.
EBITDA = net income + interest expense + taxes + depreciation & amortization expense
or
EBITDA = operating profit + depreciation & amortization expense
Example: How to calculate EBITDA in Excel or Google Sheets
As mentioned above, the income statement has all the information you need to calculate EBITDA. You can easily add the formula to your current income statement template in Microsoft Excel or Google Sheets or download the free Income Statement Template.
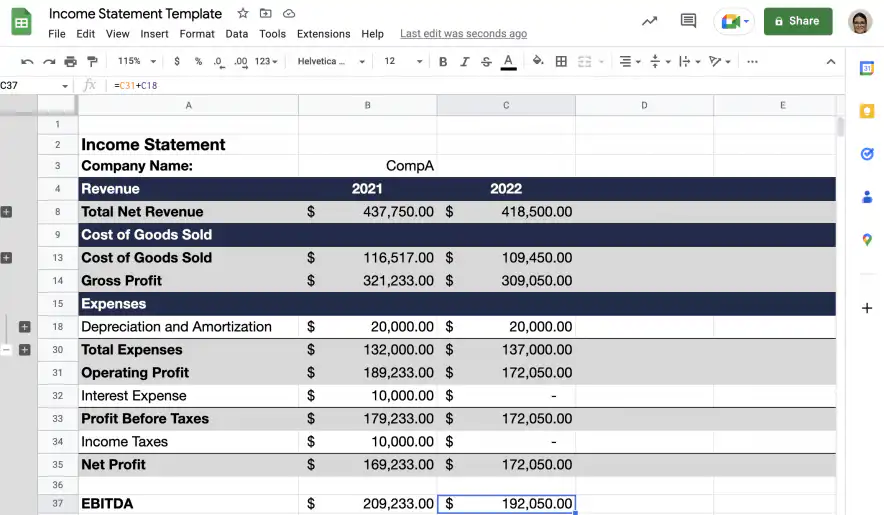
Follow the steps below to calculate the value of EBITDA directly on the income statement. The screenshots below show a modified version of the Income Statement Excel Template. Several rows have been grouped or hidden to highlight the data you need to calculate EBITDA.
1. The first step is to gather the data needed for the calculation in a spreadsheet or add the formula directly to the income statement spreadsheet.
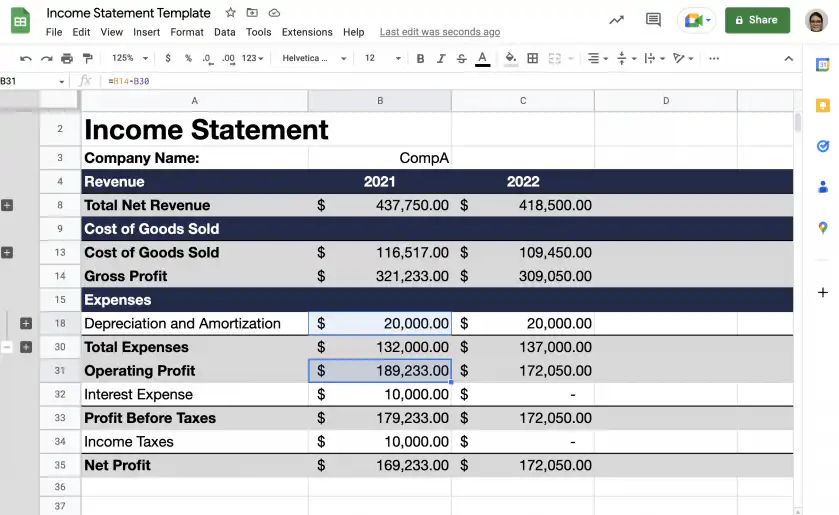
2. Click on the cell where you want the EBITDA value and type the equal sign to start adding the formula. Add the expense for ‘Depreciation and Amortization’ to the value for ‘Operating Profit’.
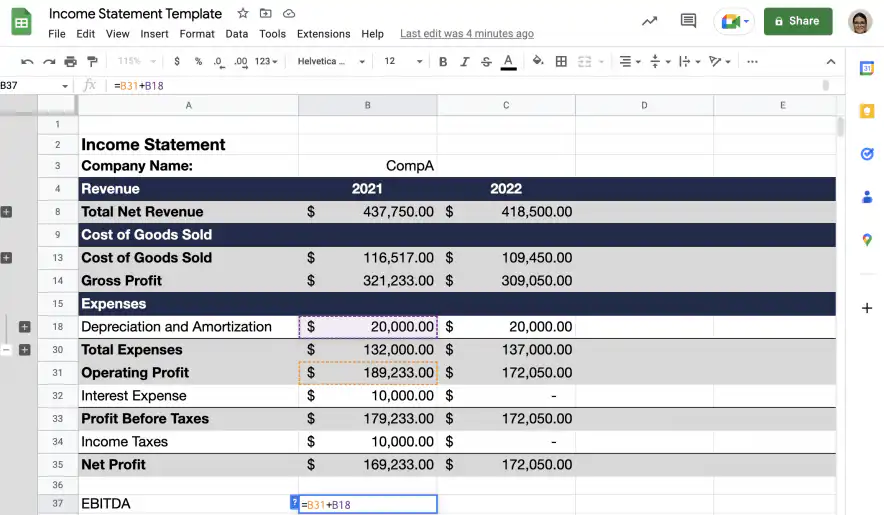
3. Press ‘Enter’ to see the value of EBITDA. You can quickly get the values for more years by dragging the formula.
Why is EBITDA calculated?
EBITDA is an important financial metric that can be used as an indicator of operating performance. It is often used in company valuations, allowing comparisons between similar companies. You can calculate EBITDA in multiple ways, and its value is used in the calculation of other important metrics.
What is EBITDA multiple and how is it calculated?
The EBITDA Multiple is a financial ratio used for company valuations. To calculate it, divide the enterprise value by the value of EBITDA. Since it is a ratio, you can compare values for similar companies in the same industry.
EBITDA multiple = enterprise value / EBITDA
What is EBITDA margin and how is it calculated?
The EBITDA margin is a financial ratio used in profitability analysis. It expresses the company’s operating profits as a percentage of revenue. To calculate the EBITDA margin, you need to divide the value of EBITDA by the value of total revenue.
EBITDA margin = EBITDA / revenue
What is adjusted EBITDA and how is it calculated?
Adjusted EBITDA is an attempt to normalize the value of EBITDA by removing anomalies, like irregular or one-time items. In order to remove these anomalies, you need to calculate the value of the required adjustments. Depending on the type of item, the adjustment is then added back or subtracted from the value of EBITDA.
Theoretically, it provides a more stable value for EBITDA and makes it easier to compare to competitors. However, there is a significant amount of subjectivity regarding the selection of items and the methods used to calculate the adjustments. For this reason, these values and the calculations behind them are scrutinized by analysts.
Is EBITDA the same as net income?
While net income considers income remaining after deducting all expenses, EBITDA doesn’t consider interest, tax, depreciation, and amortization expenses. They also tend to have different uses; EBITDA is used to calculate the earning potential of a company, while net income is used to calculate total earnings per share.
Operating income vs. EBITDA: what’s the difference?
Operating income and EBITDA are two important financial metrics used to measure the profitability of a business. Although they both measure profits, these two concepts have some significant differences. Operating income is a company’s total revenue minus its operating expenses within one period (e.g., annually). It is often referred to as earnings before interest and taxes (EBIT). On the other hand, EBITDA stands for earnings before interest, taxes, depreciation, and amortization — it measures cash flow instead of net income.
The main difference between the two metrics lies in the fact that operating income includes certain items that do not affect cash flow, such as depreciation or amortization expense, while EBITDA excludes them. This is why EBITDA is often used for comparison when comparing the profitability of companies in different industries; because operating income can be heavily influenced by non-cash charges.
In short, operating income is a measure of profits that includes non-cash expenses, while EBITDA is a measure of profits that excludes non-cash expenses. While both metrics provide valuable insight into a company’s performance, EBITDA is often the preferred metric for comparing companies in different industries.
Ultimately, both operating income and EBITDA are essential metrics for measuring a company’s profitability. When analyzing a company’s financial performance, it is crucial to understand both metrics in order to get an accurate picture of the company’s profitability.
EBITDA vs. operating income example
Let’s look at an example to better understand the difference between operating income and EBITDA. Let’s assume that Company A has the following financial data:
- Revenue = $200,000
- Operating Expenses = $150,000
- Depreciation & Amortization Expense = $10,000
- Taxes = $20,000
- Interest Expense = $10,000
In this example, we can calculate the company’s operating income and EBITDA as follows:
- To calculate the operating income:
Operating Income = Revenue – Operating Expenses – Depreciation & Amortization Expense
= $200,000 – $150,000 – $10,000
= $40,000
- To calculate EBITDA:
EBITDA = Revenue – Operating Expenses
= $200,000 – $150,000
= $50,000
As we can see from this example, operating income and EBITDA are different measures of profitability. In this case, the company’s operating income was $40,000 while its EBITDA was $50,000; the difference is due to the inclusion of non-cash expenses in the calculation of operating income.
Interest and taxes don’t change either figure, because both come after operating income on the income statement. After $10,000 of interest and $20,000 of taxes, net income is $10,000. The first EBITDA formula gives the same answer: $10,000 + $10,000 + $20,000 + $10,000 = $50,000.
Conclusion
As you have seen, EBITDA is a popular financial metric that is frequently used in company valuations and profitability analysis. This metric is used to calculate other popular financial ratios, like the EBITDA margin and the EBITDA multiple. As with any financial metric, it has limitations and should not be considered in isolation. If possible, you should use multiple methods to gain a complete picture of the company’s value or profitability.
You now know what EBITDA is and how it is calculated. You also know how to calculate it using the income statement in Microsoft Excel or Google Sheets. Finally, you know how to calculate various related metrics and how they differ from EBITDA: EBITDA multiple, EBITDA margin, adjusted EBITDA, and net profit. To learn more about financial statements and valuation methods, check out the articles below.
- How to Read a Balance Sheet
- Financial Statement Analysis
- How to Calculate the Value of a Company
- Discounted Cash Flow Analysis
To put the EBITDA formula into your monthly reporting, start from a profit and loss statement template. Then follow how EBITDA moves from year to year with horizontal analysis or trend analysis. Sheetgo’s AI finance virtual employee can pull the income statement figures from your spreadsheets into one up-to-date file, so the calculation always runs on current numbers.


 English
 Español
 Português do Brasil
 Français