


Identifying trends in your data to make more accurate predictions is useful in any industry. Trends related to your company’s finances or your investments are especially interesting. Recognizing these financial trends allows you to better understand your company’s accounting practices and improve financial planning and performance. Identifying trends in the stock market can also help you with your investment strategies.
Even within the financial industry, trend analysis is a broad term, as it makes use of multiple metrics and methods, including the horizontal analysis of financial statements and the technical trend analysis of stocks. The results of other financial analyses are often incorporated to provide more context for analyzing these trends, like horizontal and vertical analyses, variance analysis, profitability analysis, and leverage ratio analysis.
In this article, you will learn about the technical trend analysis of stocks, the different types of trends you might find, and commonly used metrics and techniques. You will also learn about the most common uses of accounting and investment analysis. Finally, you will learn how Google Sheets and Sheetgo, an AI-powered data automation platform, can help you handle the calculations and the flow of data.
What is trend analysis?
Trend analysis aims to identify and analyze potentially significant patterns in historical data. Generally, this information is used to better predict future trends. The identification and analysis of trends is also a common research objective.
You can use different types of financial datasets or documents within the finance industry. For example, you can use stock metrics in technical analysis and financial statements in horizontal analysis. There are also many different tools and techniques used in trend analysis, such as % change, moving averages, technical indicators, and charts for visualization.
When you apply trend analysis to financial statements, it is also known as horizontal analysis, because you compare the same line items across periods side by side.
What are the different types of trends?
There is no minimum time requirement for a period of time to be considered a trend, but there is a general tendency to value trends of longer duration more highly. Trend analysis uses data collected over very short and very long periods of time. Given the frequency of trading activity, stock metrics’ daily or even hourly fluctuations are potential indicators. However, if you’re analyzing a company’s long-term financial status, a chart showing a minute or hour is unlikely to be helpful; taking a longer view can identify general trends.
There are three types of trends you may find while analyzing your data.
- Uptrend: If values become consistently higher with the passage of time, you have an uptrend.
- Downtrend: If values become consistently lower, you have a downtrend.
- Horizontal: It’s possible for values to remain relatively constant, showing a sideways or horizontal trend, which indicates balanced supply and demand.
Whether an upward trend is positive or negative will depend on the metric you analyze. For example, if you’re looking at your expenses, you’d be looking for a downward trend.
Trend analysis & stock
There are two general ways of discovering trends in stock – one using technical analysis and the other using fundamental analysis.
Technical analysis
The technical analysis of historical stock data is a popular method to look for patterns or trends in stock prices, volume, and other metrics. There is some debate about how useful technical trend analysis actually is for predicting future market trends, given the vast amounts of data available on these markets.
Both trading and analysis of the stock are constant, with investors immediately reacting to fluctuations or perceived trends. This makes it a little too unpredictable for more cautious investors, who prefer to take a longer view.
Fundamental analysis
Fundamental analysis considers that the usual stock metrics don’t always reflect real value. Analysts gather all the information they can on the market they are studying, including quantitative and qualitative analysis of financial documents and contextual data. Fundamental analysis is generally used for more long-term investment decisions.
Trend analysis examples
As you have seen, trend analysis has applications in any industry. Within finance, accountants often use it to analyze the company’s financial statements and to identify trends or inconsistencies that could impact the company’s financial performance.
You can also identify trends in the technical analysis of stocks to identify fluctuations in price, volume, etc. In this section, you have examples of both the horizontal analysis of financial statements and the technical analysis of stock prices.
Trend analysis for accounting
Imagine company A wants to study trends related to Revenue and the Cost of Goods Sold (COGS) for the last few years. Horizontal analysis of their income statements can help them identify potentially significant patterns in the data, including evidence of fraud or accounting mistakes. The horizontal analysis of income statements tends to use % change, but you can use other metrics depending on the focus and purpose of the analysis.
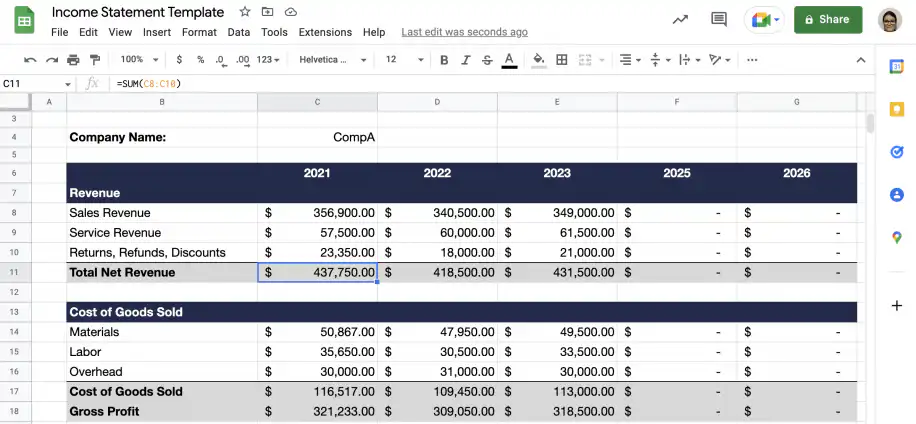
Once you have selected and gathered the required data, you need to calculate the % change for each period from the base year. To learn more about this, check out our article on horizontal analysis: definition, formula & examples. You can then chart these values, using trendlines to identify interesting patterns.
Based on any interesting patterns you find, you can analyze them in more detail using additional data and visualizations. For instance, you might want to look at the monthly statements for a particular year if you see a peak or dip in that year that concerns you.
Trend analysis for investing
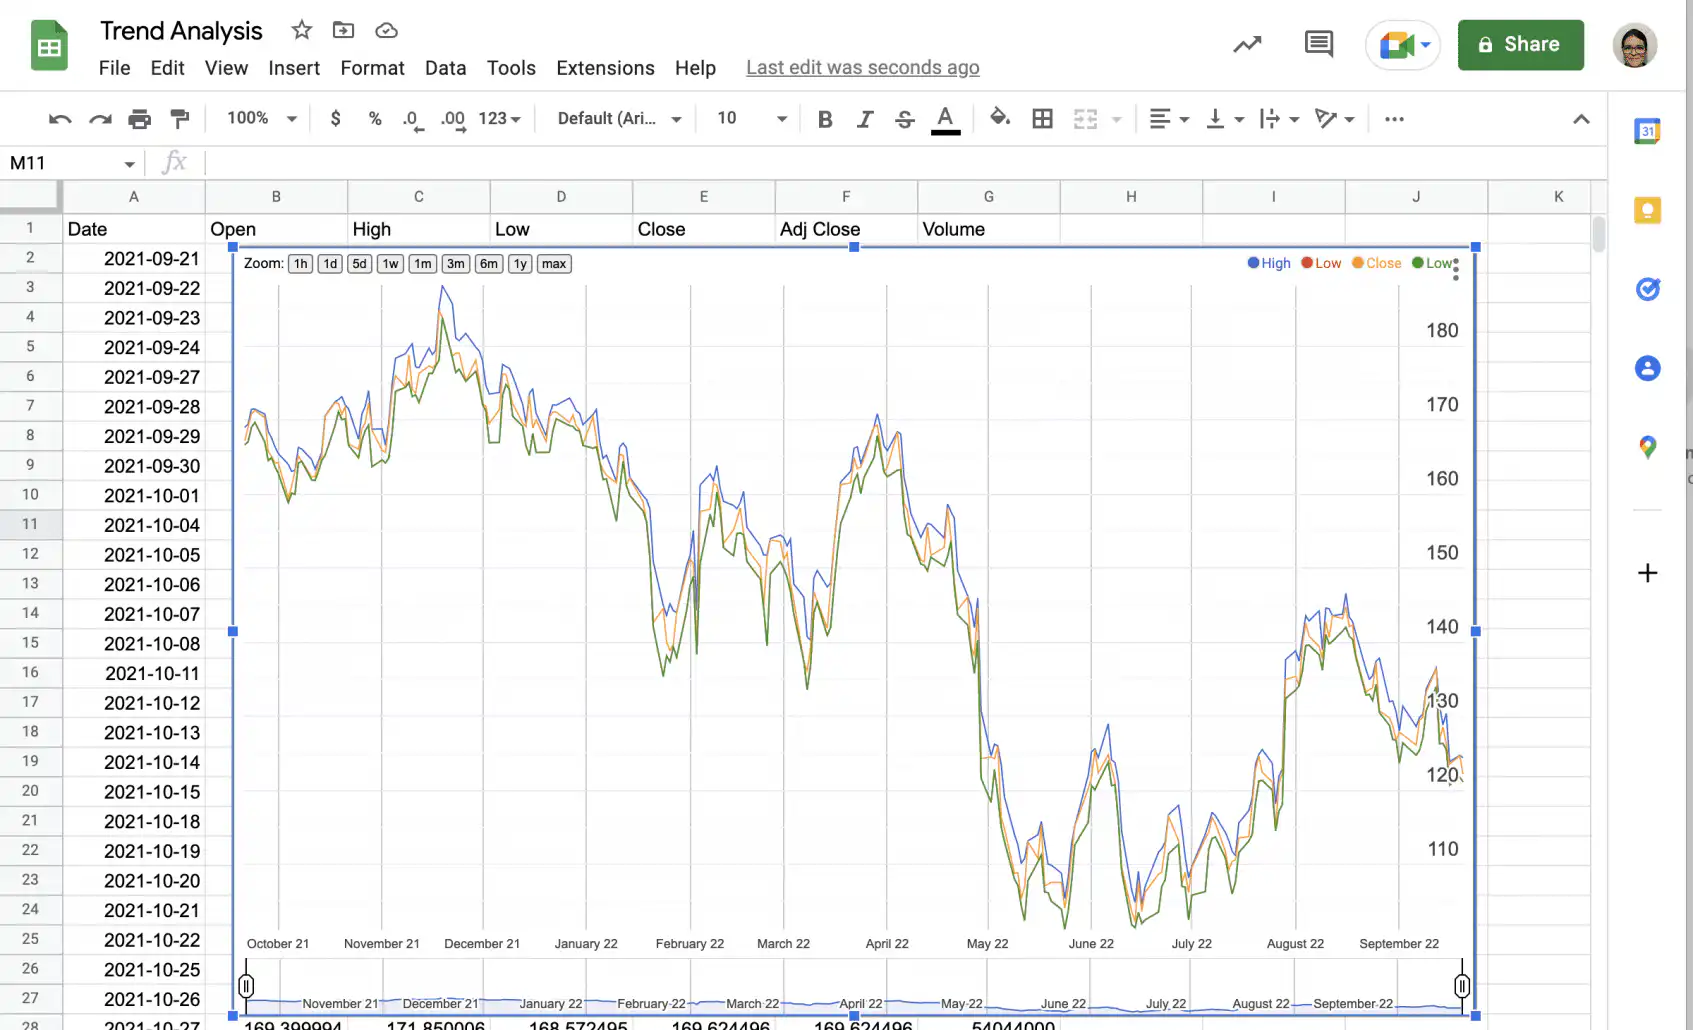
A common use for trend analysis is in the technical analysis of stocks. However, trend analysis is only one of the many techniques and metrics used in technical analysis. These include many types of visualizations, often resulting in complex charts representing multiple metrics for varying periods of time. Given the frequency of changes in some stock prices and the different investment strategies available, some charts span minutes while others span years.
Price and volume are among the most popular, but you can use many other metrics and indicators depending on the purpose of your analysis. These may include technical and price indicators, frequently based on moving averages, and momentum indicators, like the relative strength index. The GOOGLEFINANCE function in Google Sheets can pull a stock’s historical prices and volume straight into a sheet, so you can calculate these indicators next to the raw data.
To learn how to import stock data from Google Finance or Yahoo Finance, take a look at use Google Finance to get crypto prices in Sheets and how to import Yahoo Finance data into Google Sheets.
What is a trend statement?
A trend statement, also called a trend percentage statement, is a financial statement in which every line item is shown as a percentage of its value in a base year. The base year is set to 100%, and each later year is calculated as (current year amount / base year amount) x 100.
For example, if sales revenue was $356,900 in the base year and $340,500 the next year, the trend percentage for that year is about 95%. That means sales revenue fell by roughly 5% compared with the base year. A trend statement uses the same data as the % change columns in a horizontal analysis, but it shows each year as a level relative to the base year instead of as a change.
Values above 100% mean the item grew compared with the base year, and values below 100% mean it shrank. Read each line against related lines. If revenue sits at 105% while the cost of goods sold sits at 120%, costs are growing faster than sales and your gross margin is getting thinner. To try this on your own numbers, start from this income statement template in Google Sheets and add a trend column next to each year.
How to perform a trend analysis in Excel or Google Sheets?
Now that you know about the different types of metrics and calculations used in trend analysis, you probably think it would be great to automate as much of it as possible. Fortunately, you can use tools like Excel or Google Sheets to set up templates. This fixes the formulas for all the calculations you need, which helps you avoid mistakes.
With Sheetgo, an AI-powered data automation platform, you can also connect your spreadsheets so the calculations update as new data comes in. Sheetgo also lets you control who can access each part of your data, so you can share results and reports with your team automatically.
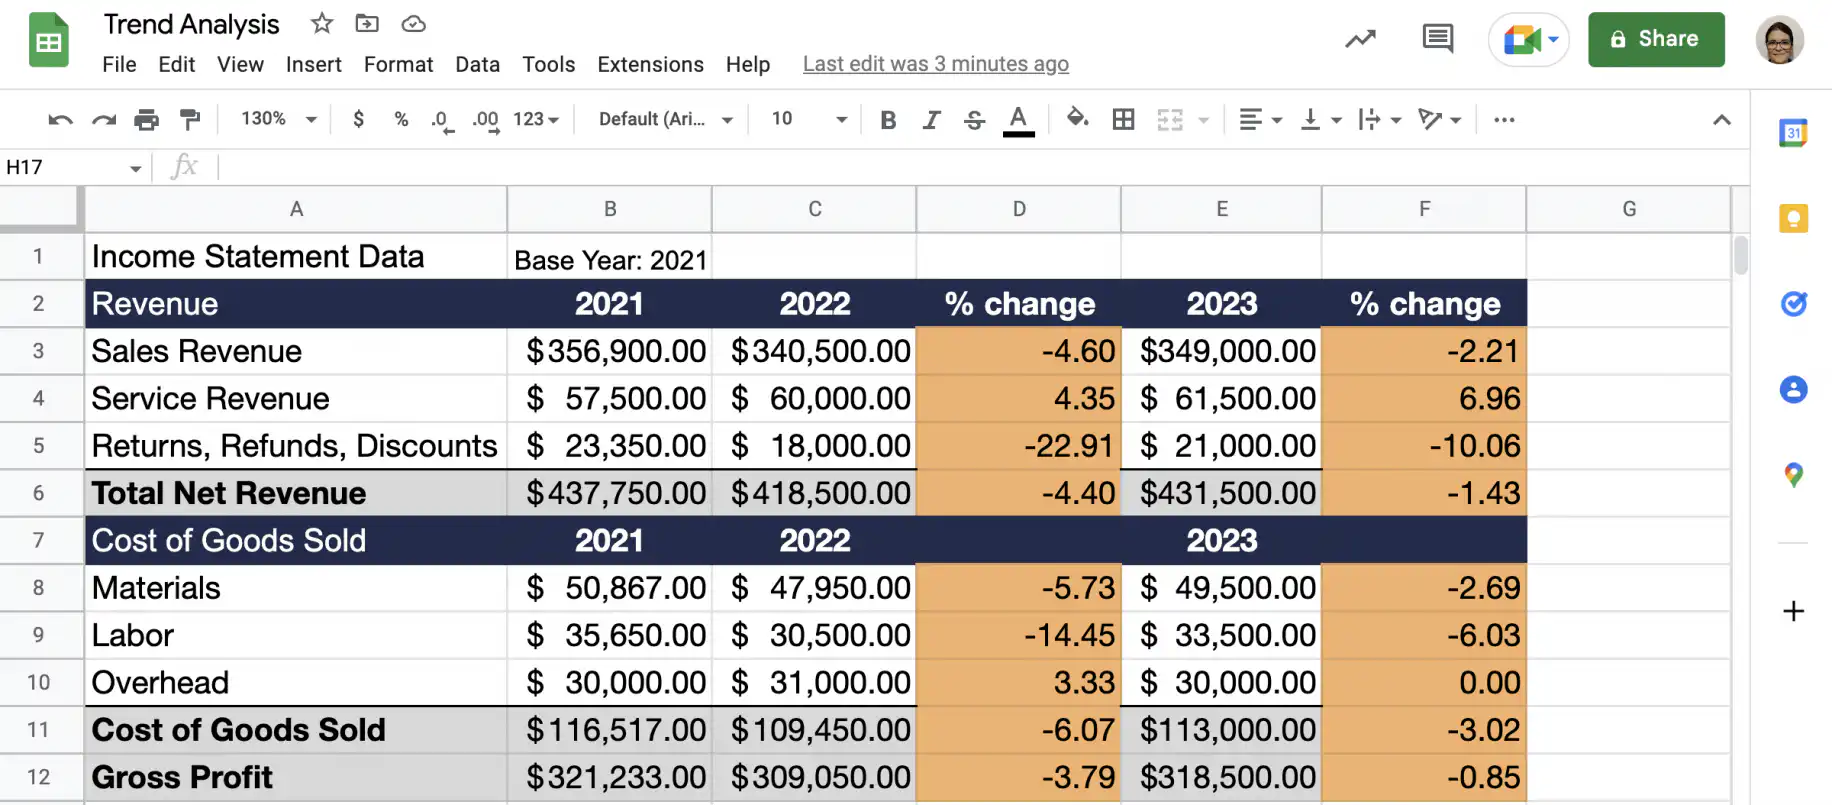
In the screenshot above, you can see that we customized this free Income Statement Template by adding columns to calculate % change. You can do this in the existing tab or create a new one and link to the values. You can also add standard charts to the template to speed up the process further. To show each line’s trend inside the table itself, the SPARKLINE function draws a small chart in a single cell.
Conclusion
As you have seen, there are different types of trend analysis. While an accountant is more likely to be interested in analyzing patterns and trends in financial statements, like expenses or income, an investor is more likely to analyze stock prices, volume, and other metrics.
It’s also important to remember that fundamental analysis – as opposed to technical analysis – also uses financial statements and other documents that can shed light on a company’s value, in addition to the price of the stock.
You now know that trend analysis can be broadly defined as analyzing patterns in historical data to predict future patterns. You also know about two common applications within the finance industry: the horizontal analysis of financial statements and the technical analysis of stocks. Finally, you know how to use spreadsheet software – like Excel or Google Sheets – to speed up calculations and how Sheetgo, an AI-powered platform, can help you automate the entire process.
If your finance team builds these reports in spreadsheets, Sheetgo’s AI finance virtual employee can take on much of the recurring work, such as projecting cash flow from the numbers you already track.


 English
 Español
 Português do Brasil
 Français