




A company’s ability to generate revenue is essential to its success, and monitoring this metric can help to assess its current and future value. This is why there are so many financial metrics related to revenue, like total revenue, Monthly Recurring Revenue (MRR), or Annual Recurring Revenue (ARR). Each metric focuses on a different aspect or a different type of revenue. Another of these metrics is Trailing Twelve Months (TTM) or Last Twelve Months (LTM) revenue.
In this article, you will learn about TTM or LTM revenue, as well as why it’s important. You will also learn how to calculate TTM and have step-by-step examples of how to calculate TTM using Microsoft Excel or Google Sheets.
What is TTM revenue?
TTM or LTM revenue refers to the revenue earned by the company in the trailing twelve months (TTM), also known as the last twelve months (LTM). TTM and LTM mean the same thing, so TTM revenue and LTM revenue are the same figure. This provides more context for assessing the company’s growth and allows you to identify specific sources of growth.
The TTM or LTM technique applies to more than just revenue and is frequently calculated for other financial metrics, like yield or the Price/Earnings ratio. These would also be calculated based on the last or trailing twelve months of data.
Why is TTM revenue important?
Revenue can be calculated for any time period you wish to analyze or represent. For instance, financial statements are commonly prepared quarterly or annually, including the total revenue for the period. However, it’s common for companies to look at revenue much more frequently, sometimes weekly. During the initial stages, it’s normal to want to keep a very close eye on revenue.
However, looking at revenue in the longer term is also a good idea to get a more accurate picture of progress. For instance, it’s much harder to distinguish actual revenue growth from seasonal growth if you’re looking at it weekly, monthly, or quarterly. TTM revenue provides a summary of the previous twelve months and can be compared to that of similar companies. It also allows you to monitor real revenue growth unaffected by seasonality.
How to calculate TTM revenue?
As mentioned, TTM is simply the sum of all revenue generated during the last twelve months. The formula is simple, and you can calculate the value at any time. For example, if you’re calculating it on December 2, 2026, you would include all revenue generated since December 2, 2025.
TTM or LTM revenue = sum of all revenue in the last 12 months
This means the specific formula will vary depending on how frequent your revenue figures are. If you’re calculating it for your own company, you have access to detailed revenue data and can calculate TTM revenue from any date, as in the example above. However, if you’re calculating it for other companies, you may only have access to quarterly figures. In that case, you can take the value for the current quarter and the three previous quarters.
TTM revenue examples
Now that you know how TTM revenue is calculated, let’s see some examples of how to do it using Microsoft Excel or Google Sheets.
Gather data
The first step is to gather the relevant revenue data in your spreadsheet. For this example, I will use the data for Company Y. I have two years of monthly revenue figures to work with, so I can calculate TTM revenue at different points.
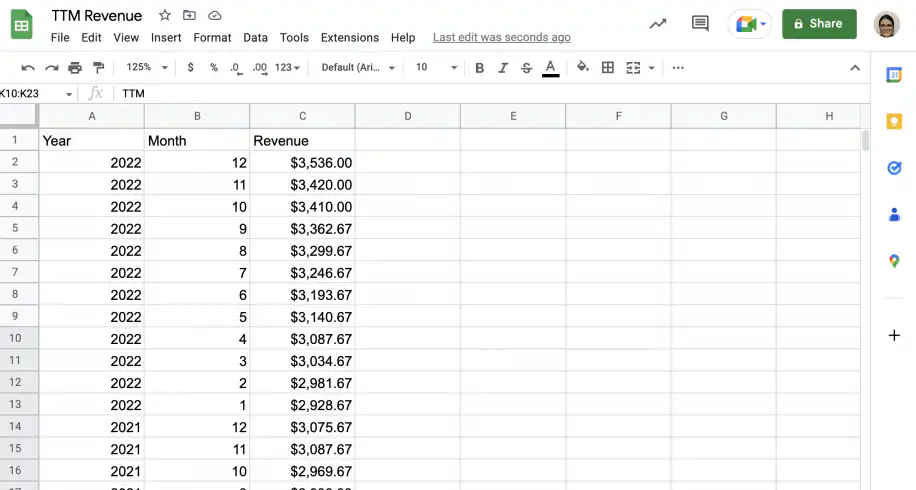
As you can see in the screenshot above, the data is listed in reverse chronological order, with the most recent figure in the top row. I will add a column for TTM Revenue calculations.
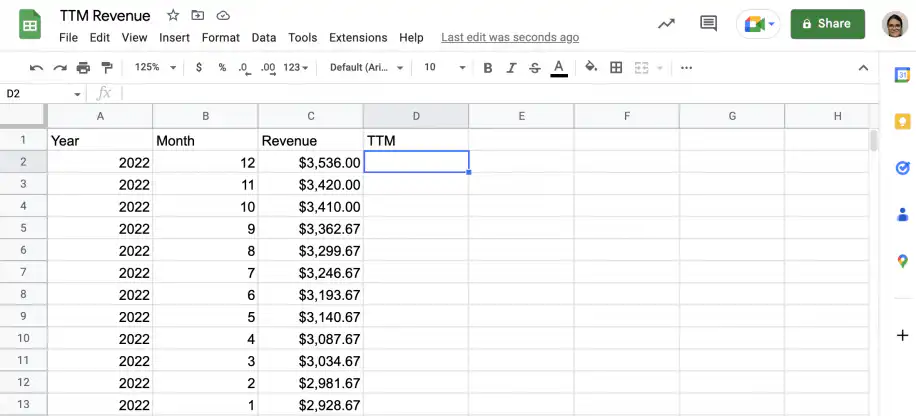
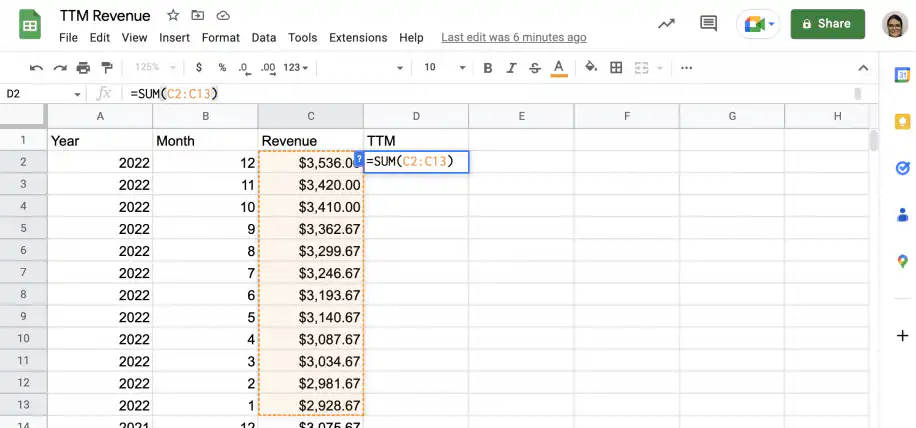
First, I’ll calculate the current value. Type the SUM formula in the row with the current monthly revenue and select the revenue figure for that month, as well as the previous 11 months.
Press ‘Enter’ to see the result.
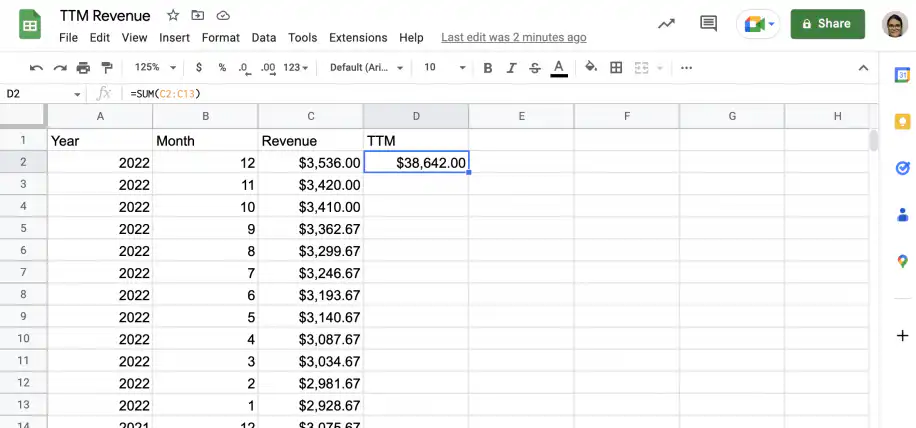
Given the way the data is structured in the spreadsheet, I can grab the fill handle and drag the formula down to get TTM revenue for previous months. However, as I only have data going back to January 2021, it doesn’t make sense to calculate it further than December 2021 since I won’t have twelve months for the calculation.
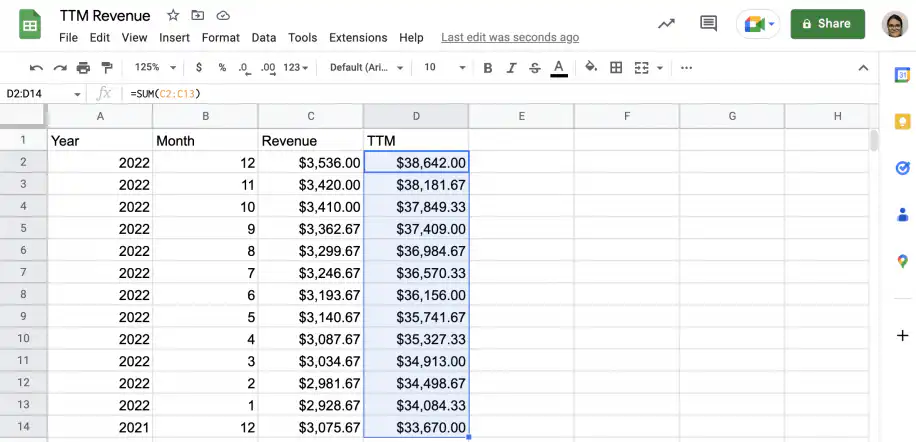
As you can see in the screenshot above, Company Y’s revenue has been growing steadily over the last twelve months.
Conclusion
As you have seen, TTM or LTM revenue are useful metrics. They can be calculated at any point in time by adding all the revenue generated in the previous twelve months. This provides a clearer picture of revenue growth, as it removes fluctuations due to seasonality or other temporary factors. The trailing twelve months technique can also be used to calculate other financial metrics and ratios.
You now know what Trailing Twelve Months (TTM) or Last Twelve Months (LTM) revenue means and why it’s an important metric to consider. You know how to calculate TTM revenue, and you have seen examples of how to calculate it using Microsoft Excel or Google Sheets.
To learn more about other revenue-related metrics, check out the articles below.
- Annual recurring revenue (ARR) and how to calculate it
- Monthly Recurring Revenue (MRR) – Your Complete Guide
A rising TTM figure is easier to read next to other numbers. A trend analysis shows the direction over several periods, and year-over-year growth compares each month with the same month a year earlier. TTM revenue is also a good starting point for revenue forecasting. If you collect revenue from several spreadsheets every month, Sheetgo’s AI finance virtual employee can gather the numbers and keep your TTM calculation up to date.


 English
 Español
 Português do Brasil
 Français