




Managing inventory is never an easy task, but always a necessary one. Depending on the types of goods and products you work with, storage and handling costs will differ. In other words, the requirements for a restaurant and a bookstore are quite different. Additionally, your business model will also affect inventory turnover. A bookstore that focuses on bestsellers and popular fiction is likely to use up inventory at a very different rate than a rare-book store.
The inventory turnover ratio shows how frequently a business consumes its inventory. In this article, you will learn to calculate the inventory turnover ratio and how to convert this value so it’s expressed in days. Finally, you will see examples of how to calculate this ratio using Excel or Google Sheets.
What is inventory turnover?
Inventory turnover shows how quickly a company uses its inventory. The inventory turnover ratio indicates how many times inventory was replenished during a specific timeframe. This value can also be recalculated so that it is expressed in days.
There are different methods available to find the inventory turnover ratio, using net sales or cost of goods sold (COGS). However, the latter is usually preferred, as using the value for COGS provides a more accurate result. When comparing ratio values, remember to check whether they were calculated using the same method. Values calculated using net sales can be significantly and misleadingly higher.
What is a good inventory turnover ratio?
A high ratio indicates that your products sell well since inventory is used quickly. However, too high a value could indicate a higher likelihood of stock shortages. A low ratio can indicate low sales or overstocking. However, what “high” and “low” means will vary significantly by industry and business model.
Generally speaking, higher values are preferred by all interested parties. However, the values themselves change drastically depending on various factors. If you work with intangibles, inventory turnover can be exceptionally high. For example, the finance and service sectors have the highest averages for inventory turnover.
How to calculate inventory turnover?
To calculate the inventory turnover ratio, divide the cost of goods sold (COGS), which you’ll find on your income statement, for a given period by the average inventory for that same period. The average inventory can be calculated by adding the beginning and end inventories for the period and dividing by 2.
You can use whatever timeframe you prefer, but it’s common to use yearly, quarterly, or monthly data. You can use the following formula to calculate inventory turns for a given period of time.
inventory turnover ratio = COGS / average inventory
where
average inventory = (beginning inventory + end inventory) / 2
You can also quickly convert this to obtain the number of days a turn takes. Use the following formula to calculate the number of days it takes to use up the inventory:
average days to sell inventory = 365 / inventory turnover ratio
How to calculate inventory turnover in Excel or Google Sheets?
As you can see, inventory turnover is a useful financial ratio. It provides insight into how well a company sells its products and manages its inventory. However, you need to recalculate this periodically to make real use of this information. By analyzing the data, you can investigate any unexpected values and uncover potential inventory problems.
In other words, this is not something you should attempt to do manually. Fortunately, tools like Excel and Google Sheets let you create templates to standardize and automate these calculations. In fact, by connecting Excel or Google Sheets with Sheetgo, an AI-powered data automation platform, you can automate inventory management and control, from collecting data from multiple users to sharing the final reports automatically.
In the next section, you have examples of how to calculate inventory turnover ratios using Google Sheets.
Inventory turnover examples
The following examples show how you can calculate inventory turns and inventory days using Google Sheets. A time period of 1 year is used in both of the examples below.
Example 1. Car dealership
In this example, I will calculate the inventory turnover ratio for a car dealership, as well as how many days a turn takes.
1. Gather data
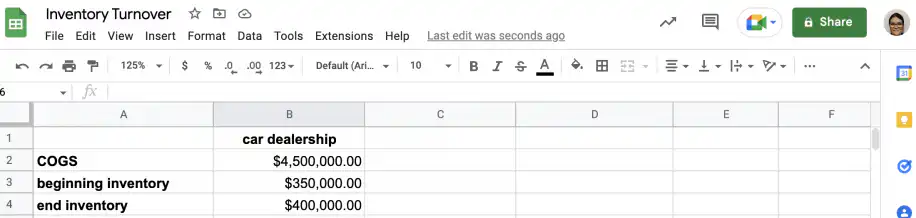
The first step is to gather the required data in your spreadsheet. You’ll need the amounts for COGS, beginning inventory, and end inventory for the period you’re interested in.
2. Calculate average inventory
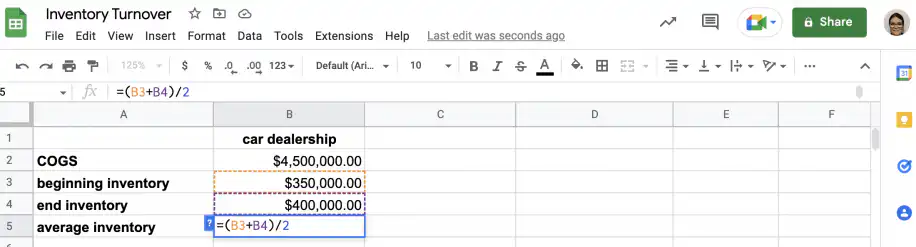
To calculate the average inventory, add the beginning and end inventories, then divide by 2.
3. Calculate inventory turns
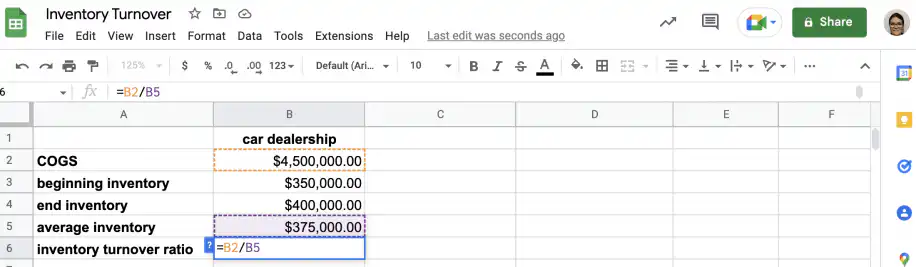
To find the inventory turnover ratio, divide the value of COGS by the value of average inventory.
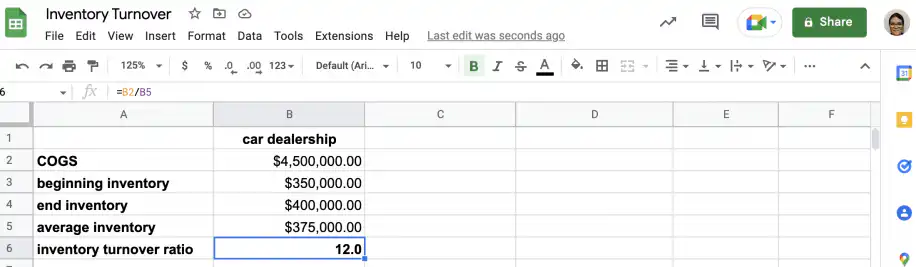
As you can see, the car dealership’s inventory turnover ratio is 12.
4. Calculate inventory days
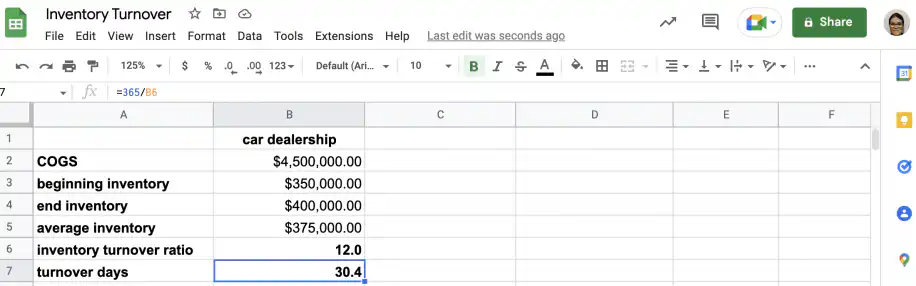
To get the average number of days it takes to turn over inventory, divide 365 by the inventory turnover ratio.
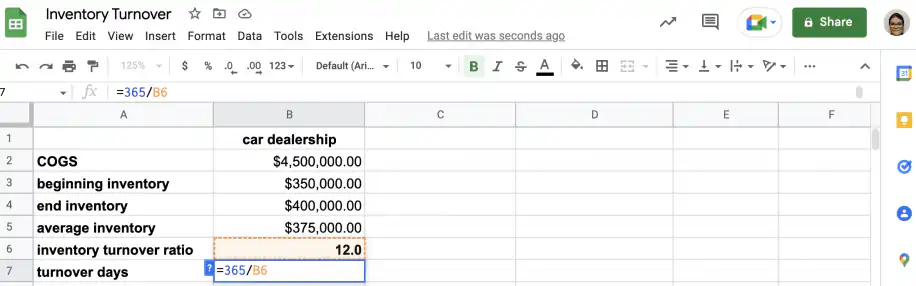
That’s it. There are approximately 12 inventory turns per year, which means inventory is renewed about once a month.
Example 2. Restaurant
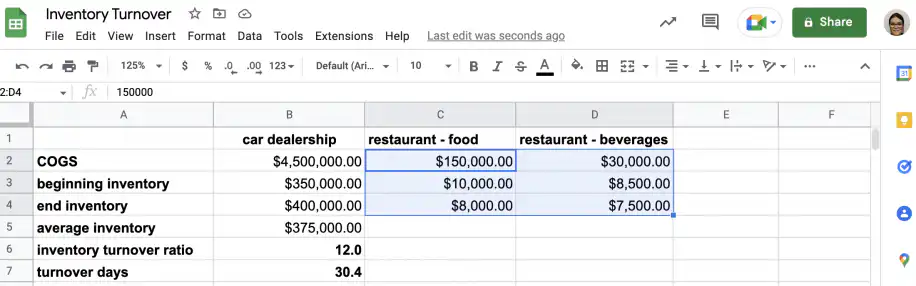
In this example, I will calculate inventory turns and inventory days for a restaurant. Due to the differences between food and beverages, it’s recommended that you calculate the ratios separately.
1. Gather data
As this example is for a restaurant, I will calculate the ratios for food and beverages separately. If you work with different products and types of goods, it’s a good idea to calculate their ratios separately.
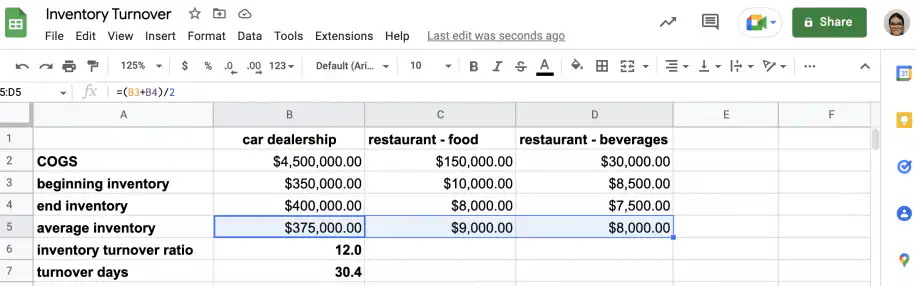
2. Calculate average inventory
To calculate the average inventory for each, add the beginning and end inventories, then divide by 2. Since I’m using the table I set up in the previous example, I can just drag the formula to the right.
3. Calculate inventory turns
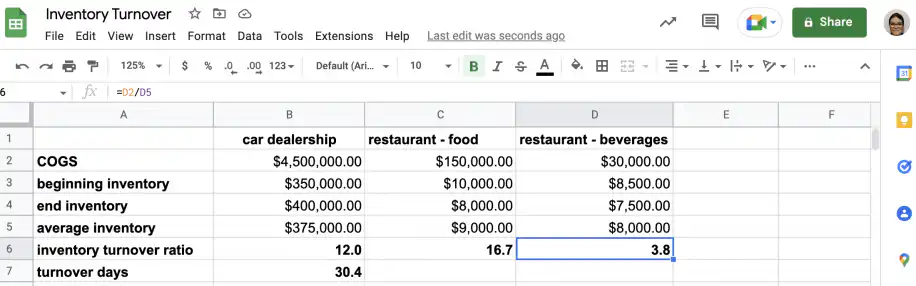
To find the inventory turnover ratios, divide the values of COGS by the values of average inventory. Below, I have simply dragged the formula to the right.
4. Calculate inventory days
To get the average number of days it takes to turn over inventory, divide 365 by the inventory turnover ratios.
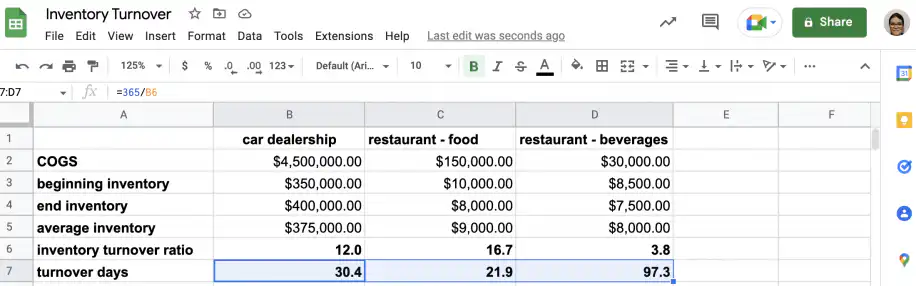
That’s it. You can see that all three have very different values. This is to be expected, considering they deal with different types of inventory.
Conclusion
As you have seen, inventory turnover varies considerably by industry and business model. As with all financial ratios, it’s important to get appropriate benchmarks to avoid meaningless comparisons. Inventory management and control are crucial to the success of a business, and inventory turnover ratios can help you keep track of progress and identify potential problems.
You now know about inventory turnover and how to calculate inventory turns and the number of days a turn takes. You also know how to use Excel or Google Sheets to find a company’s inventory turnover ratio. Finally, you know how Sheetgo can help you automate inventory management and control, including the calculation of inventory turns.
If you’d rather not update those sheets yourself, Ivy, Sheetgo’s AI inventory virtual employee, can keep your inventory data current, so your inventory turns and inventory days are always based on the latest numbers.


 English
 Español
 Português do Brasil
 Français