




Keeping a detailed record of costs is an important part of running a profitable business, but it’s not enough to just add them up. Those costs which are directly related to production will increase the more you produce, while others will remain fixed regardless of production. There are many analytical methods available to help you improve your company’s performance, all of which require you to keep accurate track of both fixed and variable costs.
In this article, you will learn about the different types of variable costs, including semi-variable ones. You will also learn how to calculate variable costs in Google Sheets, to find the total and the average variable costs. To see how fixed and variable costs work together, read our guide to cost-volume-profit analysis.
What is variable cost?
Variable costs are those directly related to production. Unlike fixed costs, which remain the same no matter how much you produce, variable costs increase the more you produce. For this reason, it’s important to ensure that all variable costs are accurately recorded.
For example, renting an office space would be considered a fixed cost, as it will not be affected by how many units of your product you make. The cost of the raw materials needed to make your product, on the other hand, will definitely depend on how many units you make.
It’s important to note that reality is a little less clear-cut, so you also need to know about semi-variable costs. There are costs that are often considered fixed but can become variable after a certain threshold has been reached, or they have a variable component. Electricity consumption is probably the most relatable example of this concept. Although you may pay a monthly rate for the service – clearly a fixed cost – your electricity consumption will likely increase as production does – a variable cost.
The more detailed and accurate your expense records, the better you’ll be able to split your costs into the fixed components and the variable ones. In the next section, you will learn the formulas for calculating variable costs.
How do you calculate variable cost?
Variable costs are calculated by multiplying the cost of making one unit by the number of units made. To calculate the total variable costs for a specific product, use this formula:
Total variable costs = Cost per unit * Units made
Variable cost metrics are needed for many types of financial analysis.
Depending on the products or services your company provides, you will need to calculate the total and the average variable costs for each product or service. In the following subsections, you will learn how to calculate these.
How to calculate average variable cost?
In order to find the average variable cost (total variable cost per unit produced), you need to sum all the variable costs for a given period and divide by the total number of units made during that period. In other words, you need to divide the total variable cost by the total number of items made.
Average variable cost = Total variable cost for period X / Total number of units made during period X
If your company makes multiple products, you can get an overall average by summing the average variable cost for each product and dividing it by the total number of products.
How to calculate total variable cost?
To calculate the total variable cost for a specific product or service, use the following formula:
Total variable costs = Cost per unit * Units made
If your company provides multiple products or services, you will have to calculate the total variable cost for each product and add them all together to get the total for the whole company.
Your company’s total costs should be equal to the sum of all fixed costs and all variable costs.
Total costs = Total fixed costs + Total variable costs (All products/services)
Variable cost examples
Let’s say Company X is working on forecasting its expenses. They make Product A and Product B. They need to calculate the average variable cost for each product and the total variable costs. This will allow them to carry out different types of financial analysis, like break-even analysis or profitability analysis.
Step 1: identify all variable costs
For this example, Company X will base their calculations on a week’s production.
1. The first step is to identify all the variable costs associated with making each product in a one-week period.
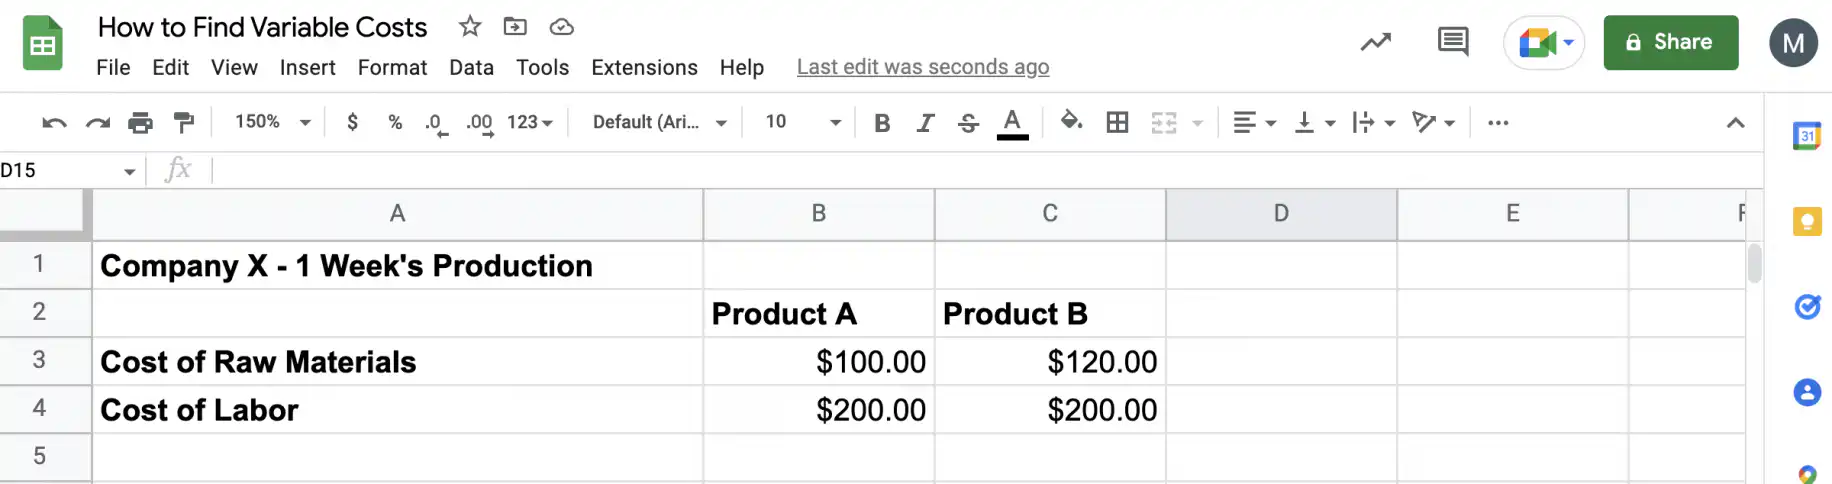
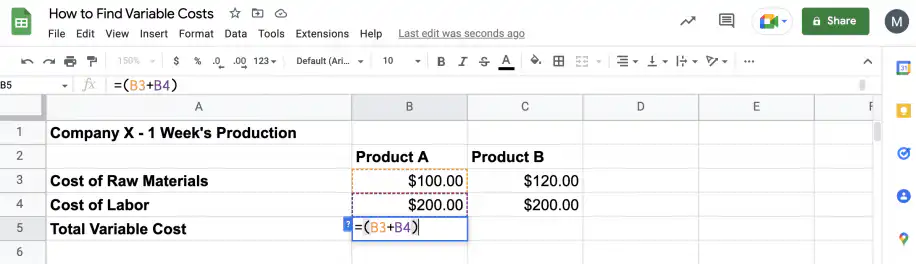
2. Add the individual costs to get the total variable cost for Product A.
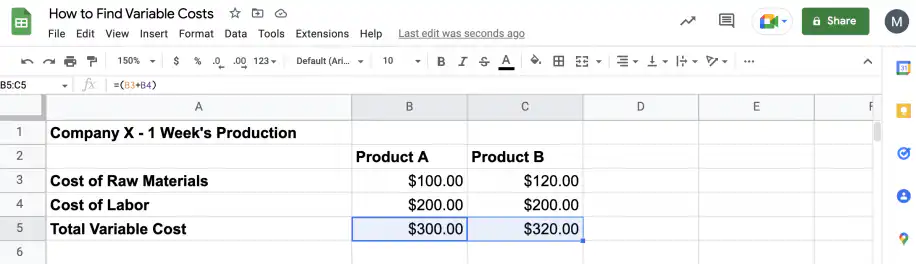
3. Repeat the previous step for Product B.
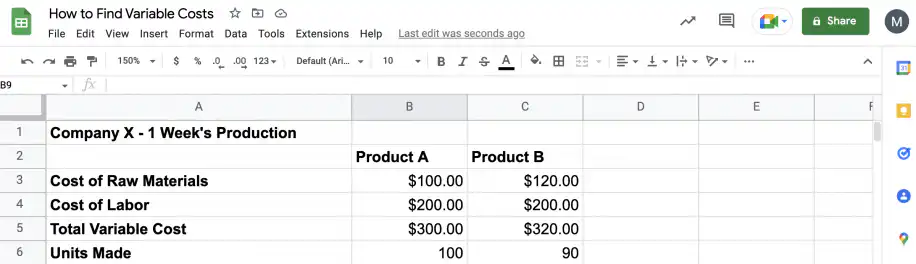
4. Next, add the values for the number of units made during the chosen week.
Step 2: calculate average variable costs
Now that you know the total variable costs and the number of units made for each product, it’s easy to work out the variable cost per unit.
1. Divide the total variable cost by the number of units made for Product A, then Product B.
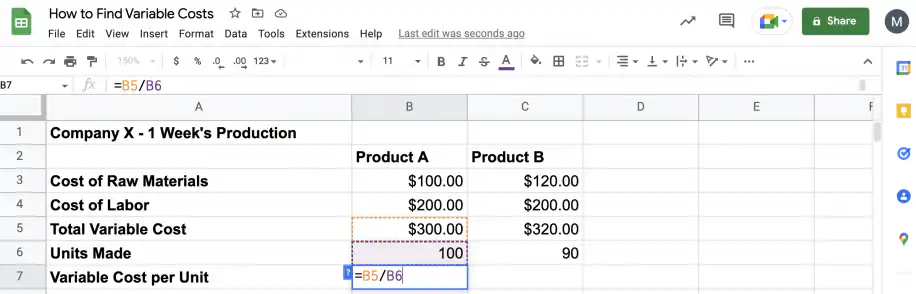
2. You now have the variable cost per unit for each product.
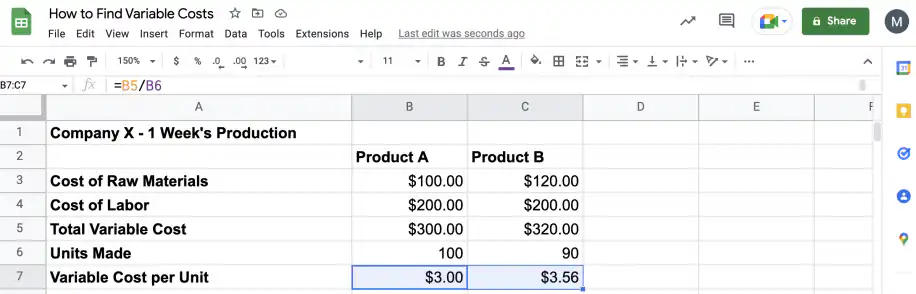
3. To find Company X’s average variable cost, you have to divide the sum of total variable costs by the sum of the number of units made.
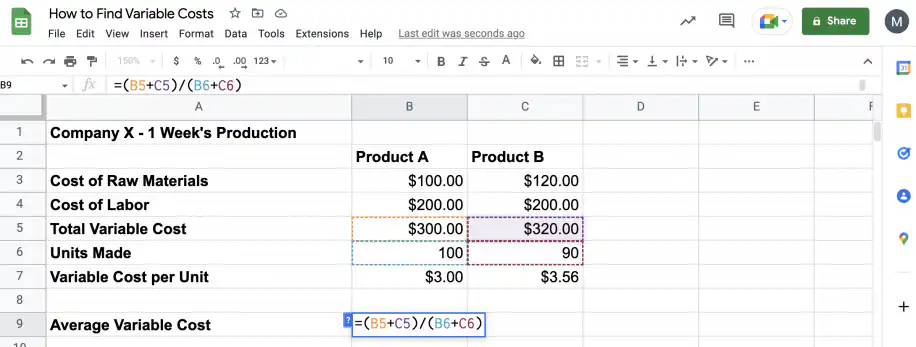
4. That’s it. The average variable cost for Company X is $3.26.
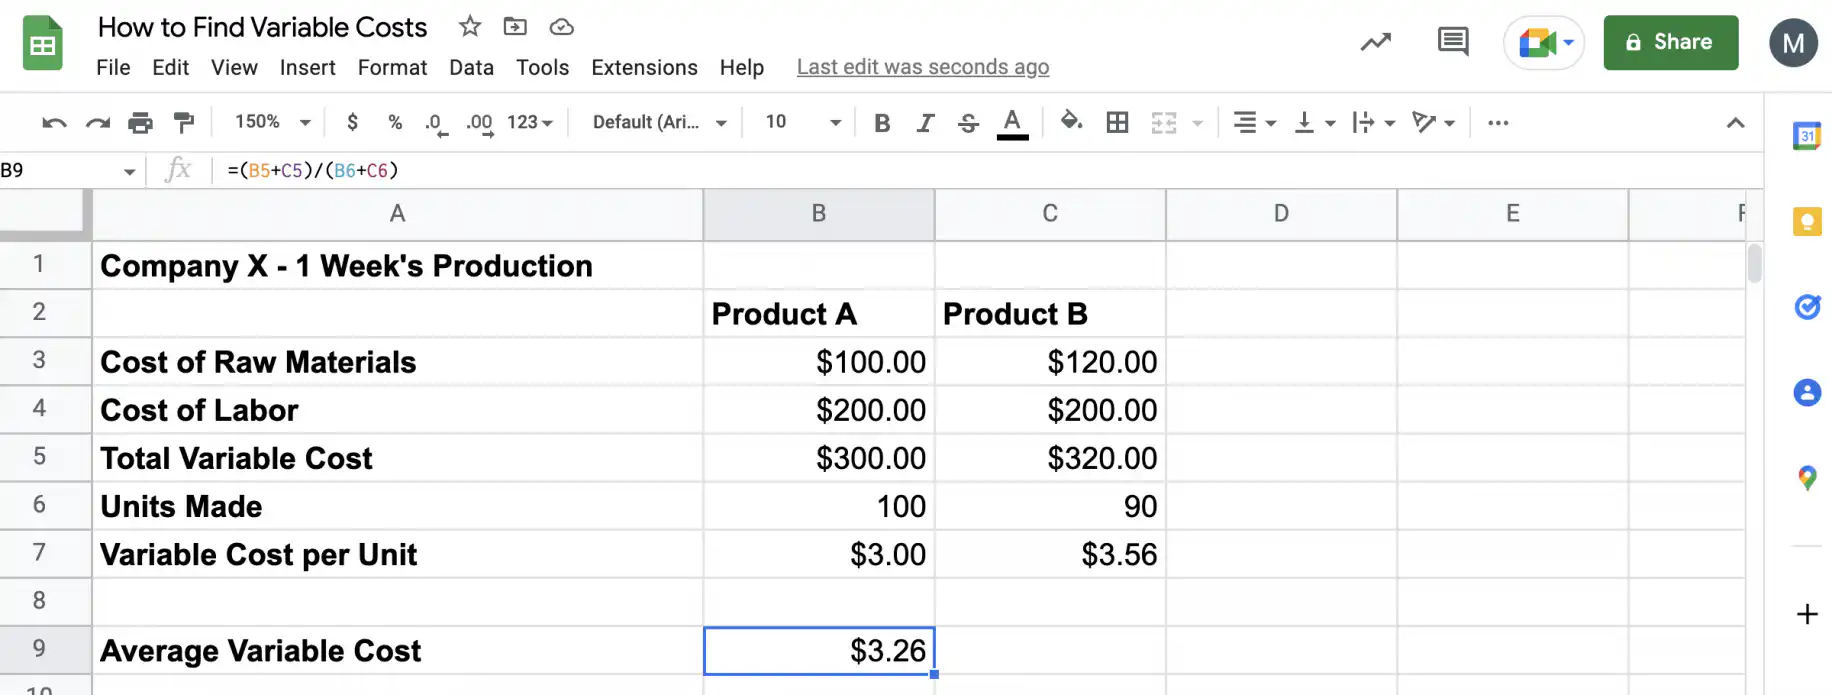
Step 3: calculate total variable costs
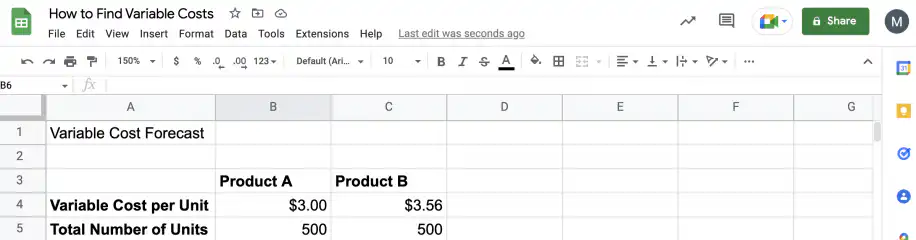
Next month, Company X wants to make 500 units of each product, and they need to know the variable costs associated with this. Since they know the variable cost per unit for each product, as well as the quantity they want to produce, they can work this out quite easily.
1. Type in the variable cost per unit for each product, as well as the quantity you want to make.
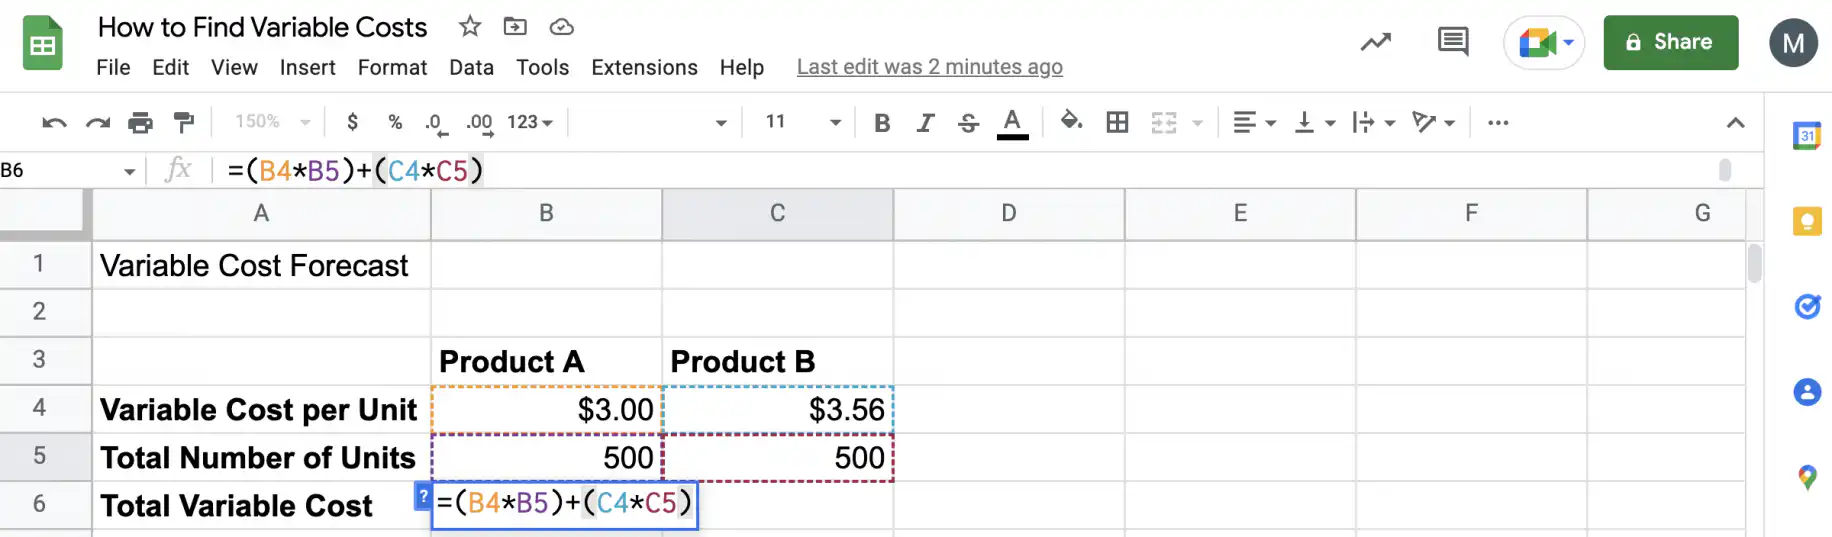
2. The total variable cost for Company X is the sum of each product’s total variable cost – variable cost per unit multiplied by the number of units.
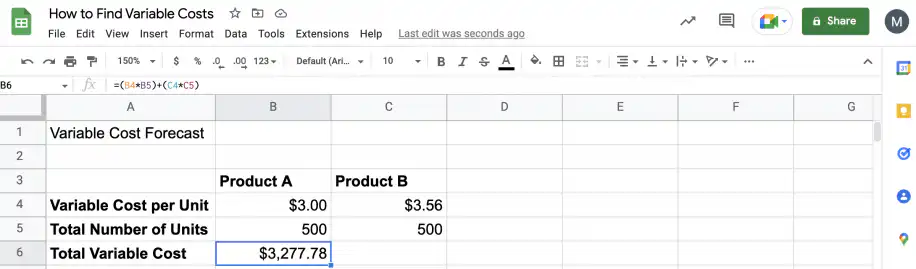
3. That’s it. If Company X decides to produce 500 units of each product, the total variable cost will be $3,277.78.
Conclusion
As you have seen, it’s important to keep a detailed record of your expenses so that you can plan ahead. Specifically, you need to distinguish between fixed and variable costs, as the latter will always increase the more you produce.
Cost data tends to be spread out over multiple documents, and different people are involved in updating it, which can make it difficult to keep track. Sheetgo’s AI virtual employees for finance can connect those files and keep your cost calculations up to date. Once your variable costs are current, you can check them against your budget with a budget variance analysis.
You now know about variable costs and how important it is to keep accurate track of them. You also know how to use the formulas to calculate your variable costs in Google Sheets.


 English
 Español
 Português do Brasil
 Français