
Get help

Help center

Guides and answers

Contact support

Write to our team

Sign in to

Workflows

Build processes with your team

Automations

Connect files and automate tasks

One system, four parts

AI agents

Virtual Employees that work 24/7

Automations

Connect files and automate tasks

Workflows

Build processes with your team

Data Space

Trusted data sharing and control

Solutions by department

Finance

Reports, budgets, and reconciliations

Inventory and manufacturing

Stock, orders, and production in one view

HR

Timesheets, attendance, and reviews

Project management

Status and workload across projects

Sales and CRM

Leads and deals kept up to date

Education

Student records and school data

Finance

Turn manual finance work into reports that update themselves.

What Finance teams automate

  • Track payables and receivables
  • Build cash flow statements
  • Compare budget against actuals

Inventory and manufacturing

See stock levels and automate ordering.

What inventory and manufacturing teams automate

  • Track inventory across multiple sites
  • Connect sales, purchasing, and warehouse data
  • Link a barcode scanner to your sheet

HR

Run recruitment, attendance, and OKR tracking from your sheets.

What HR teams automate

  • Track recruitment and onboarding
  • Record team OKRs and results
  • Track check-ins, check-outs, and leave

Project management

Assign tasks and track hours without manual updates.

What project teams automate

  • Assign tasks and track status changes
  • Estimate effort and log hours worked
  • Track milestones across projects

Sales and CRM

Track leads and sales performance with automated reports.

What sales teams automate

  • Track and convert leads
  • Set sales goals and track team metrics
  • Monitor sales KPIs on dashboards

Education

Automate attendance, grades, and school purchasing.

What schools automate

  • Track attendance and notify parents
  • Record and compare class grades
  • Track inventory lent to students and staff

Find a use case

By department

How each team uses Sheetgo

By industry

How each industry uses Sheetgo

By company size

Small, medium-sized, or large

Learn

Blog

Guides and product news

Customer stories

How teams like yours use Sheetgo

Help center

Guides and answers

Why Sheetgo

Compare

How Sheetgo compares with other tools

Security

How we protect your data

Trust center

Our compliance details

Sign in to

Workflows

Build processes with your team

Automations

Connect files and automate tasks

One system, four parts

AI agents

Virtual Employees that work 24/7

Automations

Connect files and automate tasks

Workflows

Build processes with your team

Data Space

Trusted data sharing and control

Solutions by department

Finance

Reports, budgets, and reconciliations

Inventory and manufacturing

Stock, orders, and production in one view

HR

Timesheets, attendance, and reviews

Project management

Status and workload across projects

Sales and CRM

Leads and deals kept up to date

Education

Student records and school data

Find a use case

By department

How each team uses Sheetgo

By industry

How each industry uses Sheetgo

By company size

Small, medium-sized, or large

Get started

Templates

Ready-made workflows to start from

Learn

Blog

Guides and product news

Customer stories

How teams like yours use Sheetgo

Help center

Guides and answers

Why Sheetgo

Compare

How Sheetgo compares with other tools

Security

How we protect your data

Trust center

Our compliance details

Help center

Guides and answers

Contact support

Write to our team

Workflows

Build processes with your team

Automations

Connect files and automate tasks

Current ratio: calculation, formula & examples

Whether you’re an accountant, an investor, or a business owner, you probably spend quite a bit of time worrying about the state of the company’s health. One particular area of interest is the company’s liquidity: given its assets, can the business pay back its debt in time? Two frequently used liquidity ratios are the current ratio and the quick ratio. The current ratio divides current assets by short-term liabilities to indicate the company’s ability to pay the latter using the former.

In this article, you will learn about the current ratio and how to use it. You will also learn how to add the formula to your spreadsheet to automatically perform current ratio calculations. Additionally, you will learn how tools like Google Sheets and Sheetgo, an AI-powered data automation platform, can help you set up a template and automate data flows, calculation updates, and sharing.

Why is current ratio calculated?

The current ratio is one of multiple financial ratios used to assess the financial health of a company. Specifically, the current ratio expresses a business’ ability to pay back short-term debt using only current assets. These include highly liquid assets like cash and marketable securities, but also less liquid assets, like inventory.

Current ratio calculation

You can calculate the current ratio – also known as the current asset ratio – by dividing current assets by current liabilities. Remember to only include current assets and liabilities in your total – no long-term investments or debt.

The data you need is in the company’s financial statements; the values for current assets and current liabilities are on the balance sheet.

Current ratio formula

To calculate a business’ current ratio, use the following formula:

current ratio = current assets / current liabilities

What is a good current ratio?

A current ratio between 1.5 and 3 is generally considered good. Since this ratio is calculated by dividing current assets by current liabilities, a ratio above 1 implies that the company can cover current liabilities within a year.

If the ratio is above 3, the company may be mismanaging or underutilizing assets. If the ratio is below 1, the company’s current liabilities are greater than its assets. This can cast doubt on the company’s liquidity and its ability to pay back short-term debt.

However, there are always exceptions, particularly as some accounting methods and financial strategies could result in abnormally high or low current ratios. For example, keeping a very tight inventory control or heavily reinvesting in the company can lead to lower current ratios. That’s why it’s important to consider multiple ratios and metrics in your analysis: to avoid drawing inaccurate conclusions.

Quick ratio vs current ratio

Another popular liquidity ratio is the quick ratio. Unlike the current ratio – which weighs all current assets against current liabilities – the quick ratio focuses exclusively on quick assets. These assets can be converted into cash quickly, usually within 3 months.

Current ratio examples

If a company has current assets valued at $185,000.00 and its current liabilities total $103,000.00, the current ratio can be calculated as follows:

$185,000.00 / $103,000.00 = 1.796116505

A ratio of 1.8 would usually be considered a healthy current ratio.

However, if current assets are worth $56,000.00 and liabilities are $135,000.00:

$56,000.00 / $135,000.00 = 0.4148148148

A current ratio with a value of 0.41 is something that most investors would be concerned about, barring exceptional circumstances.

How to calculate the current ratio in Google Sheets?

Let’s say you want to calculate the current ratio for Company A in Google Sheets. The company has the data shown below on the balance sheet.
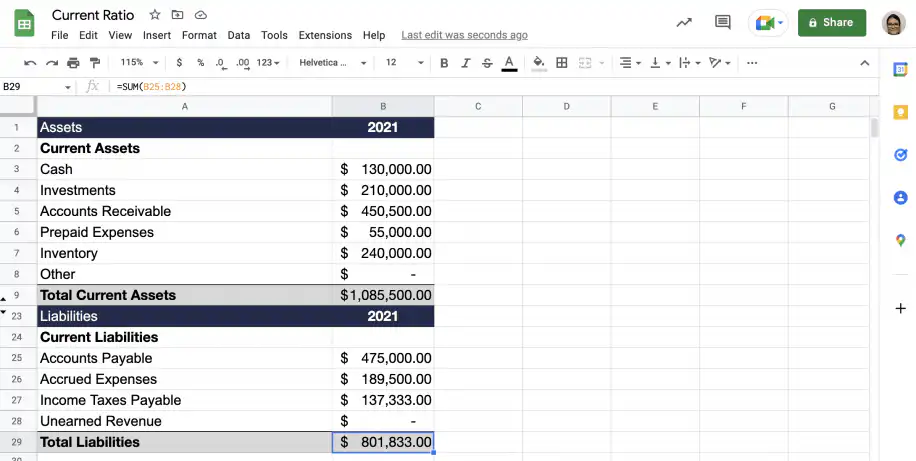
Current ratio calculation — Company A balance sheet in Google Sheets with total current assets and total liabilities for 2021

1. In an empty cell, type in the ‘=' sign and click on the cell with the value for total current assets.
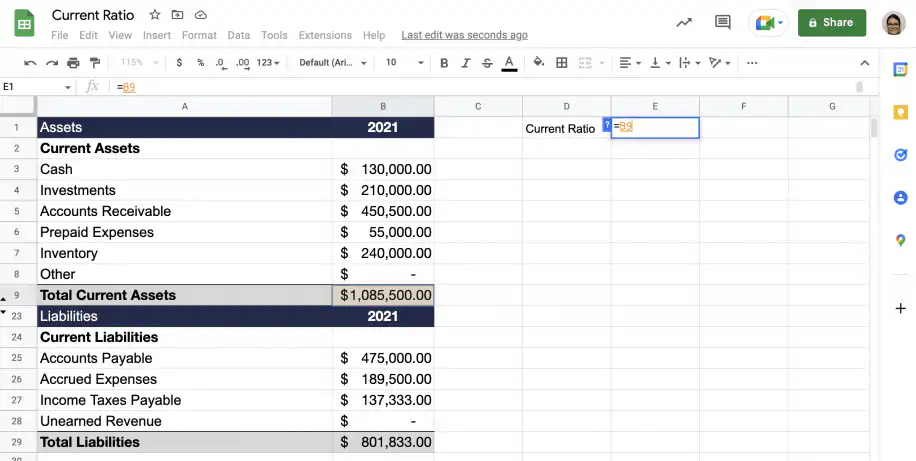
Current ratio formula — =B9 typed next to Current Ratio, pointing at total current assets of $1,085,500.00

2. Add the ‘/’ sign and click on the cell with the value for total current liabilities.
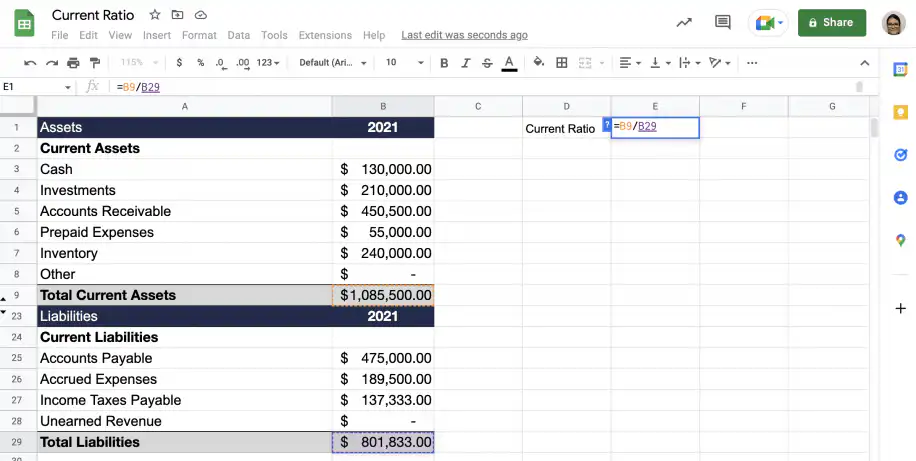
Current ratio formula — =B9/B29 dividing total current assets by total liabilities of $801,833.00

3. Press “Enter” to get the current ratio.
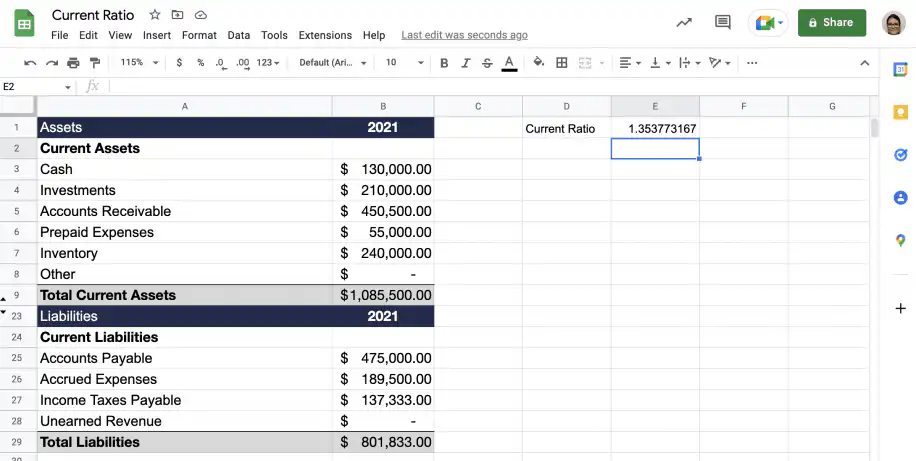
Current ratio calculator — current ratio of 1.353773167 returned in cell E1

Conclusion

You now know how to calculate the current ratio and how to interpret its value. You also know how to add the formula to your financial statement spreadsheets to calculate it automatically. With Sheetgo’s AI finance virtual employee, you can automate the entire process, from collecting the balance sheet data to sharing the results. Automate the tedious tasks to focus on staying updated to make informed decisions.

As you have seen, the current ratio is one of various ratios commonly used by accountants and investors to evaluate a company’s financial health in terms of its liquidity. Another popular liquidity ratio is the quick ratio, which you can learn more about in our blog.

To learn more about other financial ratios and analyses, check out the articles below:

● Available 24/7

Put Owen on your finance ops

Sheetgo's finance virtual employee keeps your numbers current and your reporting on time. Your data stays in Google Sheets; you work with Owen in Slack, Teams, or Google Chat.

You may also like…

simple finance add on featured image

Build a stock portfolio spreadsheet, track your investments

Staying on top of your investments can be a real challenge, particularly if you manage them through many brokers. In this post we will...
finance

How to use Google Sheets for currency conversion

Staying up to date with the latest conversion rates can be a daunting task. But it doesn’t have to be. Read on to learn how to use Google...
finance processes and templates

8 steps to prepare a bank reconciliation statement

Bank reconciliation is a crucial financial process for businesses to ensure that records match bank statements. In this post, we'll...