


Visualizations are a great way to gain further insight into your data. Different types of visualizations allow you to represent your data differently, so you can better understand what it means. Google Sheets offers a wide range of charts, but choosing the best one to visualize your data is up to you. The histogram is a great way to represent the value distribution of a given variable in terms of intervals. These intervals, known as bins or buckets, represent the frequency with which values in that interval appear in the data.
In this guide, you will learn what a histogram is and how it differs from a column or bar chart, as well as how to create one in Google Sheets. You have step-by-step instructions on how to set up the data, create the histogram, and customize it to fit your needs. Finally, you will learn how to create a histogram using two sets of data.
What is a histogram?
The histogram is a type of chart used to illustrate the distribution of values for a particular variable. The range of values is divided into equal-size bins or buckets along the x-axis, each representing an interval within this range. Along the y-axis, the height of the bins represents the frequency with which values in that interval occur.
While they are similar in appearance, a histogram and a column or bar chart are quite different. Usually, column or bar charts are used to visualize categorical data. For example, bar charts are frequently used to visualize survey responses to multiple-choice questions. For that kind of data, see how to create a bar chart in Google Sheets. Histograms, however, are used to visualize the distribution of numerical values for a numerical variable, like age, height, or grades.
For example, you can use a histogram to show the distribution of scores for a particular test. The range of the scores is given by the lowest and highest score, and you divide it into equal-sized bins. After assigning the scores to their corresponding bins, you count the number of occurrences per bin. Alternatively, you can take advantage of the fact that Google Sheets can do all of this for you.
How to make a histogram in Google Sheets step-by-step?
Google Sheets makes it very easy to create a histogram chart without worrying about creating or filling the bins. Select the range of cells containing the values for your variable and go to Insert > Chart. Check that ‘Chart type’ is ‘Histogram chart’ in the ‘Chart editor’.
1. Set up data
Fortunately, when using Google Sheets to create the histogram, there’s very little to set up: a column with all the values for your variable. They don’t even have to be in any particular order.
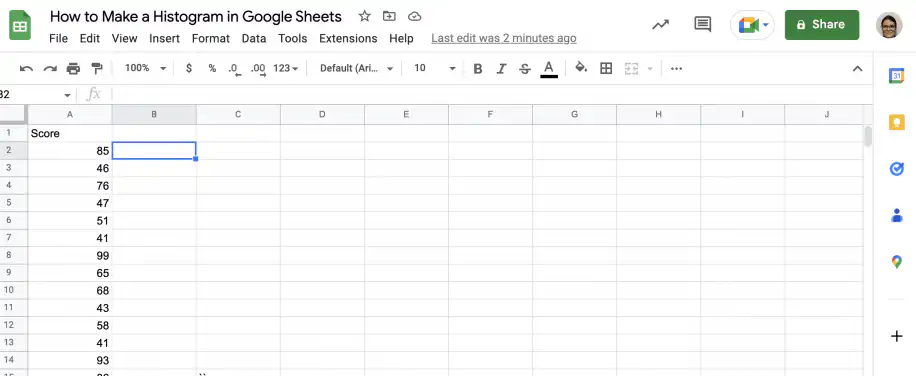
2. Insert chart
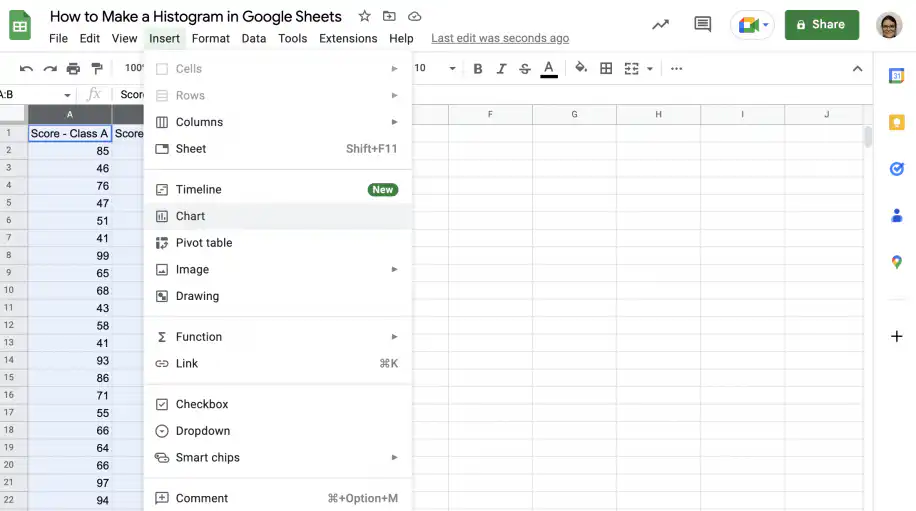
Select the cells with the values and go to Insert > Chart. For more on the chart editor, see how to insert a chart in Google Sheets.
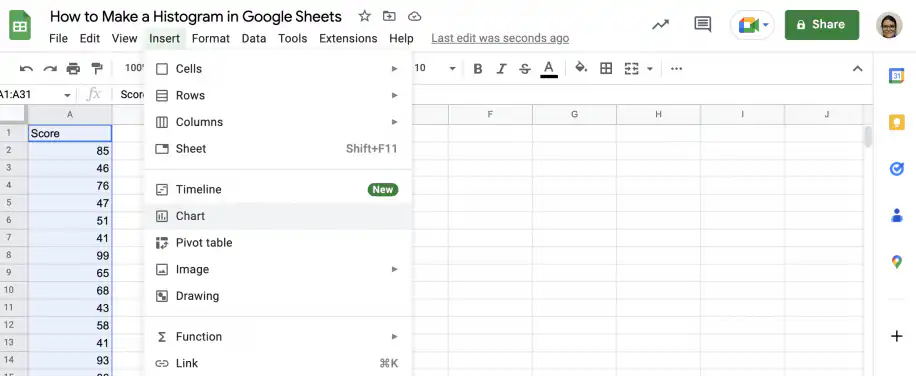
3. Select chart type
In the ‘Chart editor’ sidebar, check that ‘Histogram chart’ is selected under ‘Chart type’.
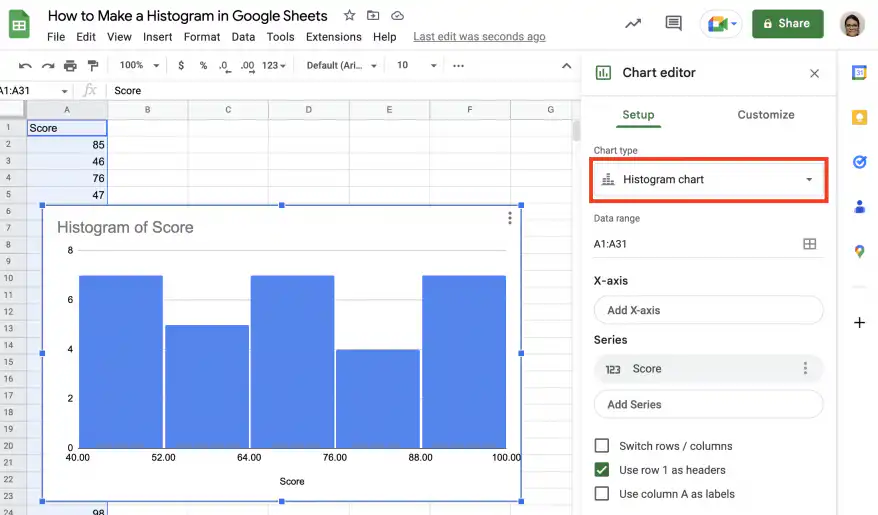
How to customize a histogram in Google Sheets?
Once you have your histogram, you can edit and customize it to your liking. Below, you have instructions on how to customize the fonts and colors, how to edit titles and labels, how to change the buckets and add item dividers, and how to add a second set of data to create a double histogram.
Change chart style
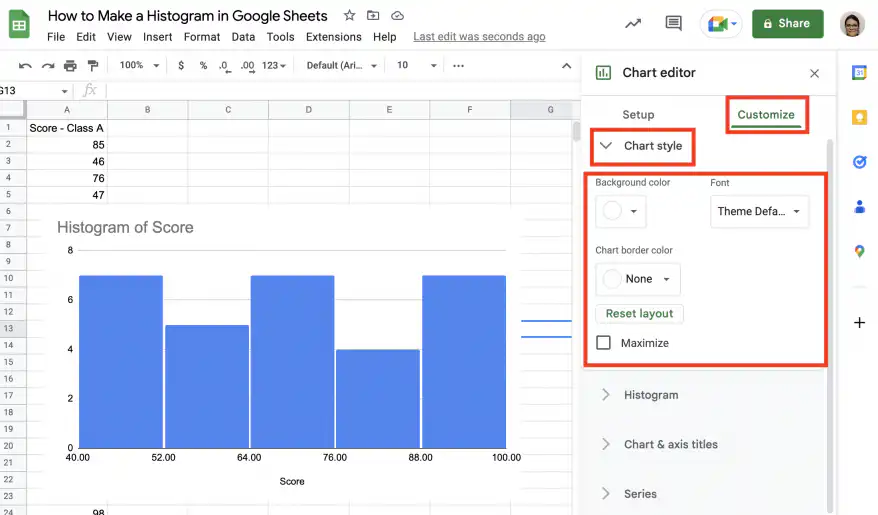
In the ‘Chart editor’, click on the ‘Customize’ tab and then on ‘Chart style’ to expand the options.
As shown in the screenshot below, you can change the font, background color, and border color.
Change chart titles
To change any of the titles, click on ‘Chart & axis titles’ and then on the drop-down menu directly under it.
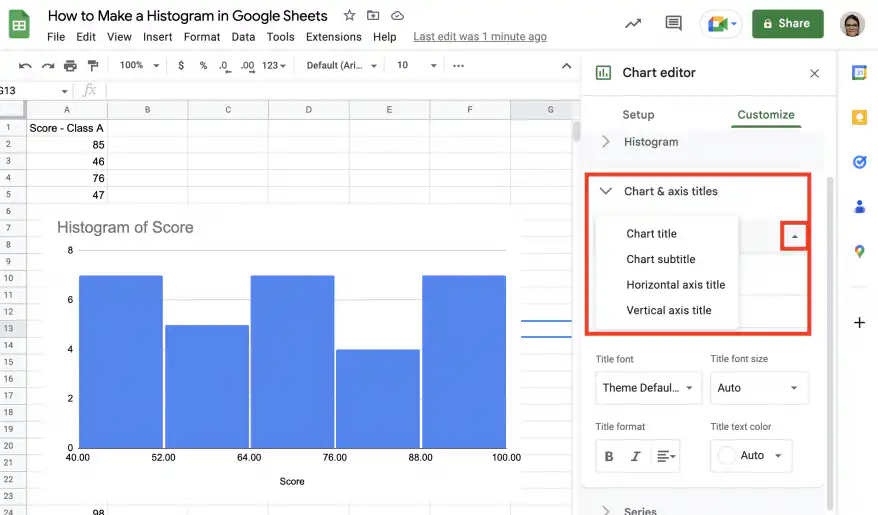
For each title, you can edit the text, font, font size, format, and text color.
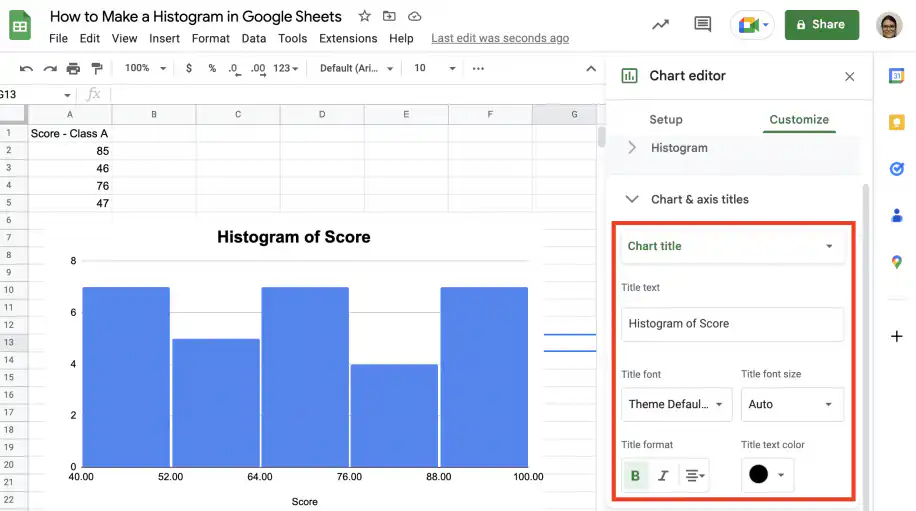
Change bins
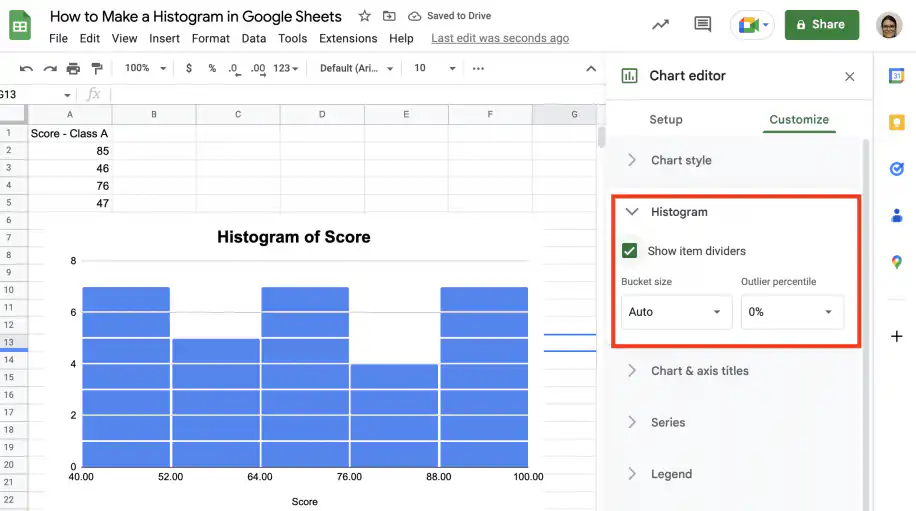
Under ‘Histogram’, you can specify the size of the bins or buckets and outlier percentiles, as well as add item dividers within the buckets.
Add a series to make a double histogram
If you already have a histogram with one set or series of values, you can easily add another series to create a double histogram.
In the ‘Setup’ tab, edit the data range to include the second column with values.
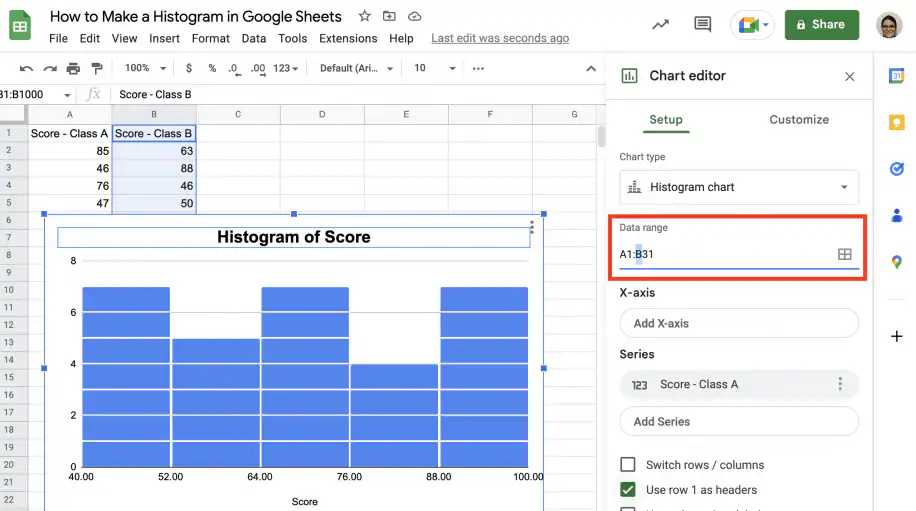
Click ‘Add series’ and select the second set of values.
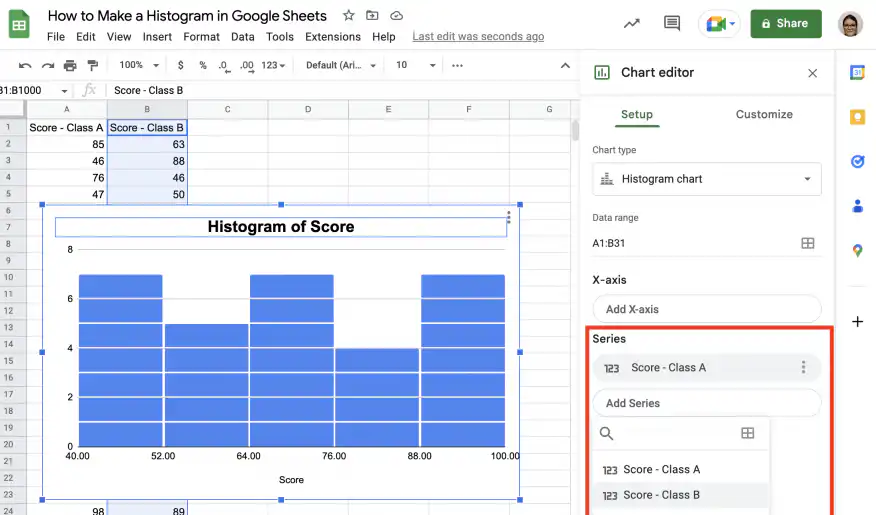
That’s it. You have your double histogram.
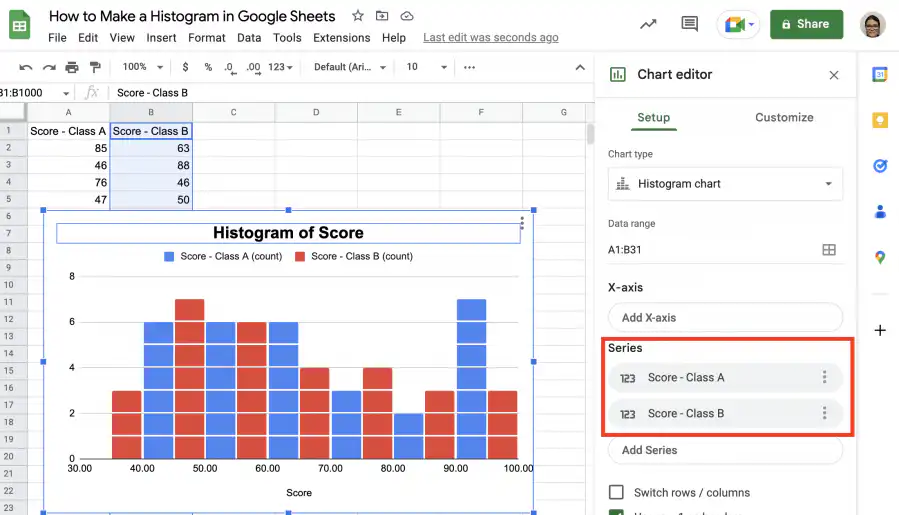
How to make a double histogram in Google Sheets?
You can make a double histogram in Google Sheets in a few simple steps. First, select both sets of values. Second, go to Insert > Chart. If the histogram chart is not chosen automatically, change it under ‘Chart type’ in the editor. You will need to make some small adjustments to the series.
1. Select both sets of values and go to Insert > Chart.
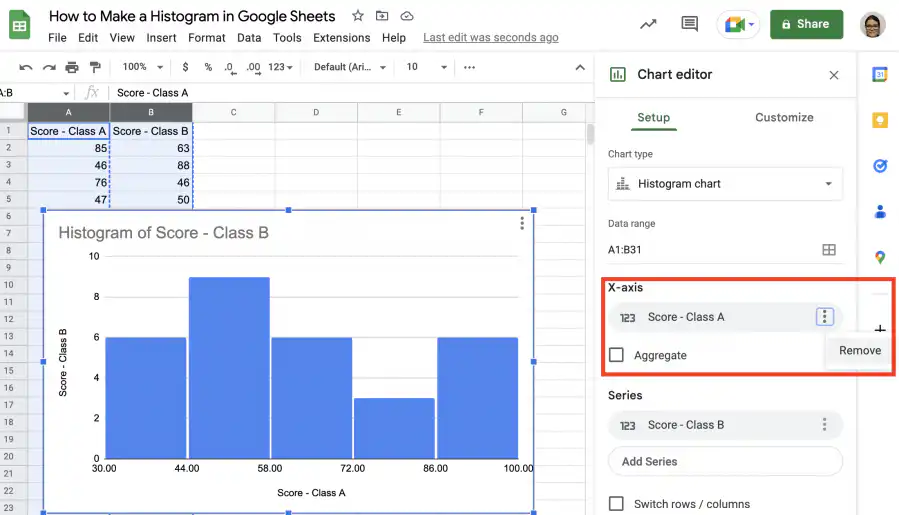
2. In the ‘Chart editor’, check that ‘Histogram chart’ is selected under ‘Chart type’. Remove the first set of values from the X-axis, as shown below.
3. Add the first set of values as a series, as shown in the screenshot below.
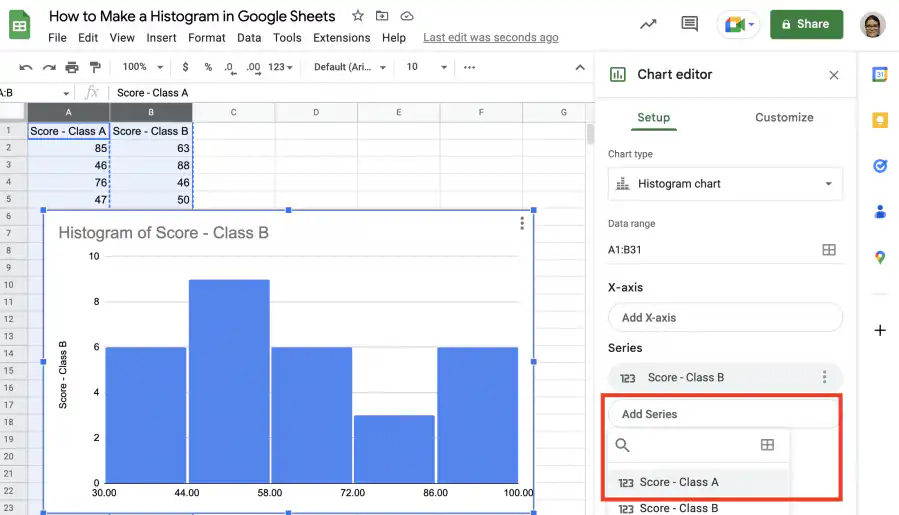
4. Remember to remove the Y-axis title, as shown below.
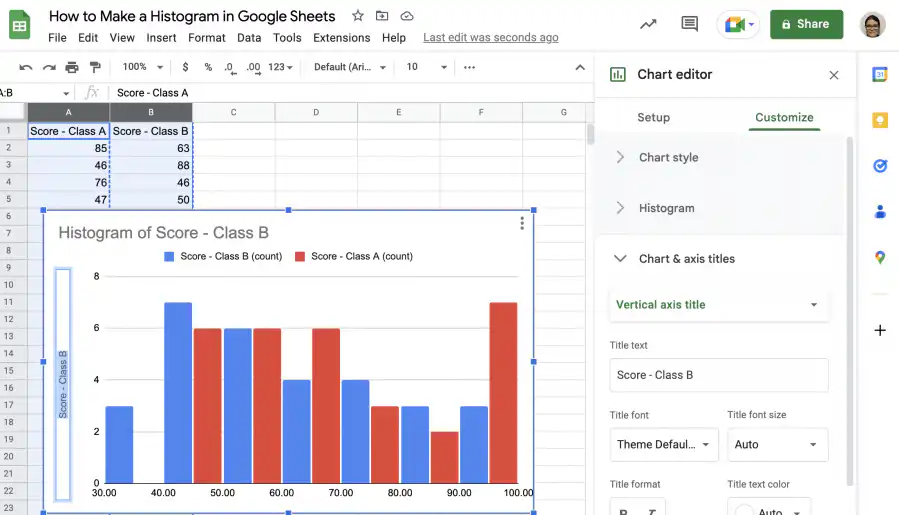
5. That’s it. You have your double histogram so you can compare the two sets of values.
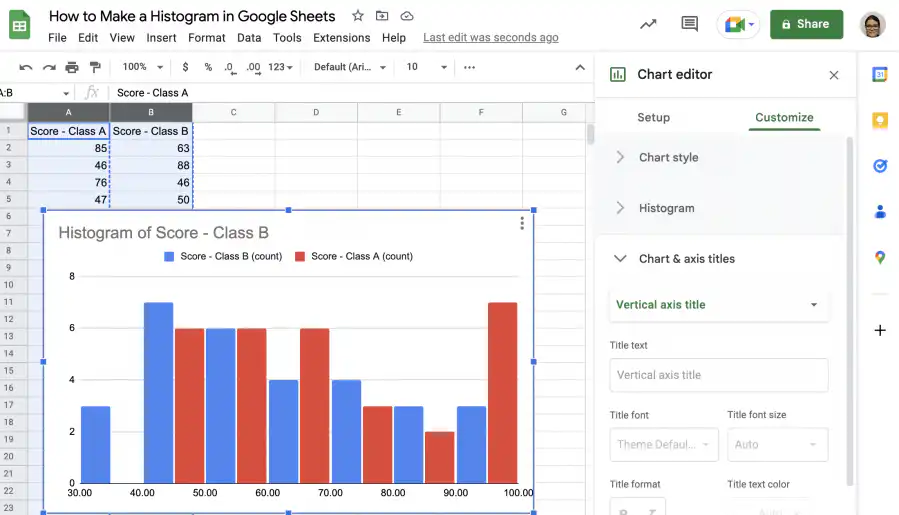
Conclusion
As you have seen, histograms are a great way to visualize the frequency distribution of values for a numerical variable. The range of values is divided into equal intervals called bins or buckets, and the values are assigned to their corresponding bucket. The buckets are placed along the horizontal axis from lowest to highest, and the height of the buckets indicates the frequency of values in that interval.
You now know what a histogram is and how it differs from column or bar charts. You also know how easy it is to create a histogram chart in Google Sheets, as you don’t even need to set up or fill the buckets. Finally, you also know how to customize your histogram and change its style, edit the titles and labels, and add another series to create a double histogram.
To learn more about charts and graphs in Google Sheets, check out these guides on:

 English
 Español
 Português do Brasil
 Français