



Google offers a variety of free and user-friendly tools for data collection, transformation, and analysis. Google Data Studio (now called Looker Studio) is a great complement to Google Sheets since its wide range of features will help you create professional reports for your clients, colleagues, or managers.
This tutorial for beginners will explain what Google’s Data Studio is and the main benefits of using it; you’ll then learn how to navigate and add to the dashboard, how to import your own data to create a report, and finally, how to share your report with others. Google renamed Data Studio to Looker Studio in 2022, so the screenshots in this guide show the older Data Studio interface.
What is Google Data Studio?
Google Data Studio is an online service for data visualization and reporting. Although it can be applied to a great variety of business domains, it has gained more traction among marketers and data analysts. Below, we answer some of the most common questions related to this service:
- Is Google Data Studio free to use? Like most of Google’s online tools, Data Studio is free to use. Google also sells a paid Looker Studio Pro plan with extra team management features, but you don’t need it to follow this tutorial.
- Is Google Data Studio easy? Like the majority of tools provided by Google, it is user-friendly and can easily be used as an alternative to more complex forms of interactive reporting, such as Tableau and Power BI.
- What are the benefits of using Google Data Studio? In addition to being completely free and intuitive, it allows you to import data from a wide range of sources, including Google Ads, Google Analytics, Google Sheets, YouTube Analytics, and BigQuery.
- What can Google Data Studio do? As a data visualization and reporting tool, it allows you to transform data into charts, tables, or diagrams. More importantly, it is great for synchronous collaboration and real-time monitoring.
As mentioned, Google Data Studio is a free service for data visualization, so you will unlock its full potential from the very beginning, from sharing reports to accessing any of the Google Data Studio templates. Let’s see how you can use Google Data Studio in a few simple steps.
How to use Google Data Studio?
Google Data Studio is a cloud-based tool, so you only need to sign in using your Google account. If you don’t already have one, remember that you can easily create one for free. Let’s see how to start using Google Data Studio.
1. Sign in to your Google account.
2. Go to lookerstudio.google.com (the old datastudio.google.com address redirects there)
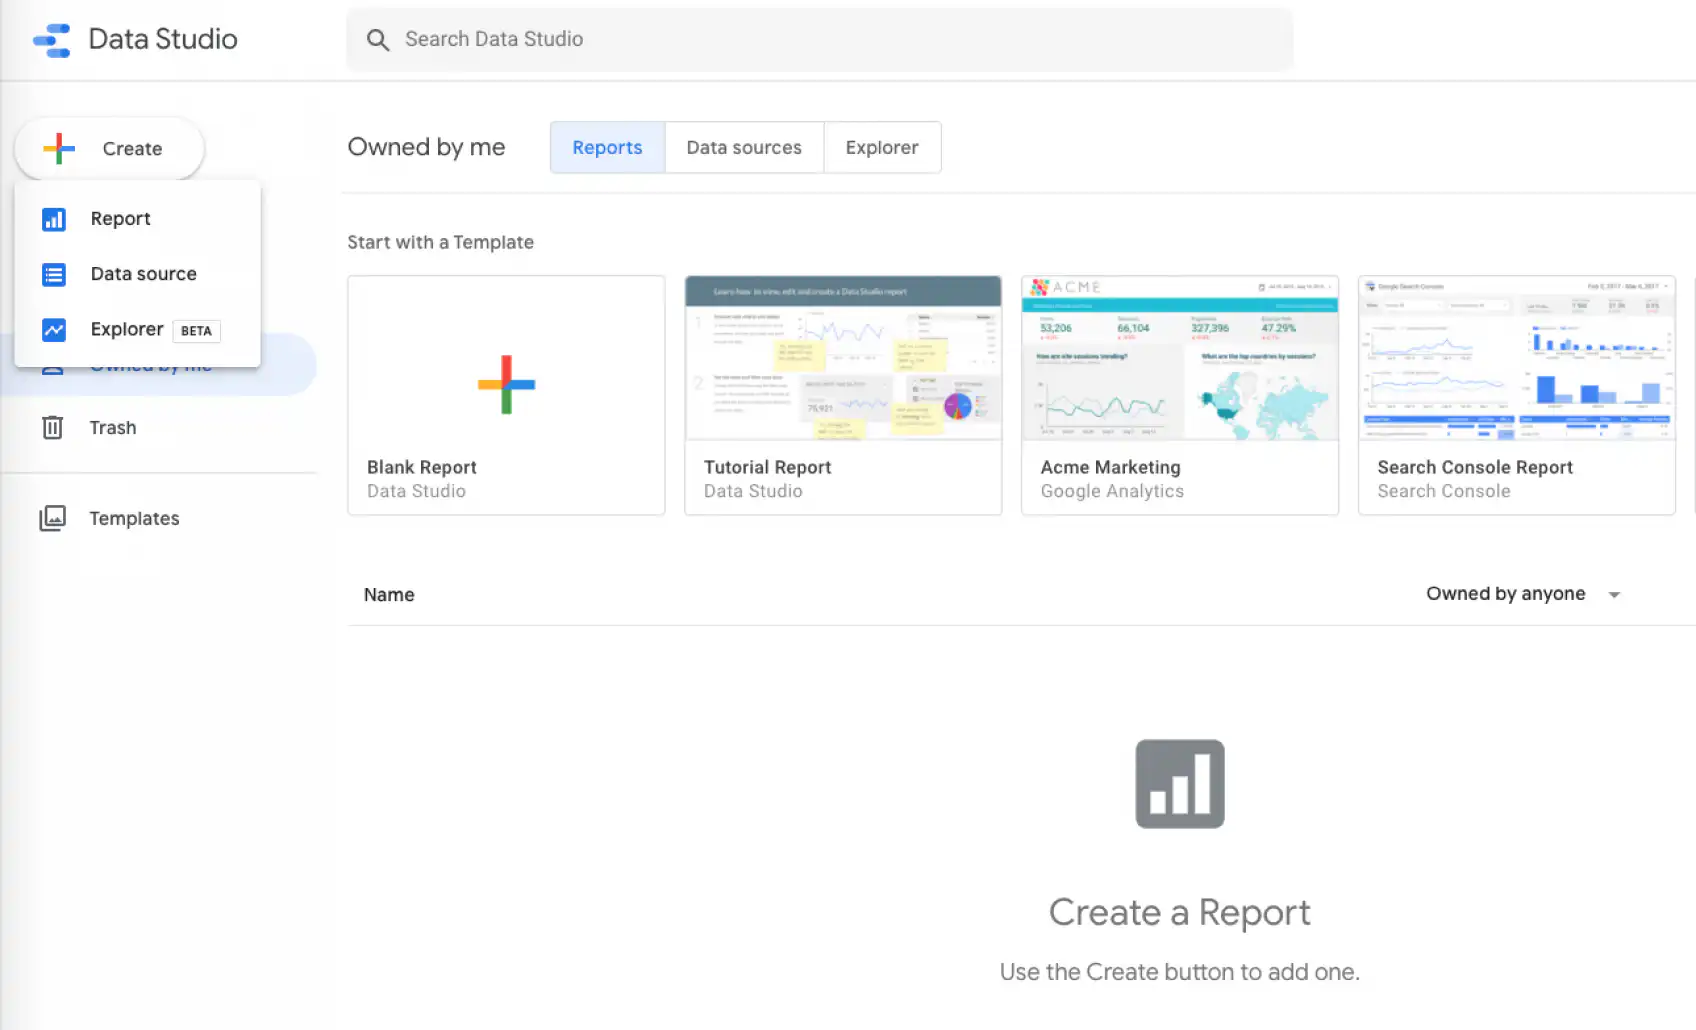
Before creating your first Google Data Studio dashboard, let’s describe the key features shown below.
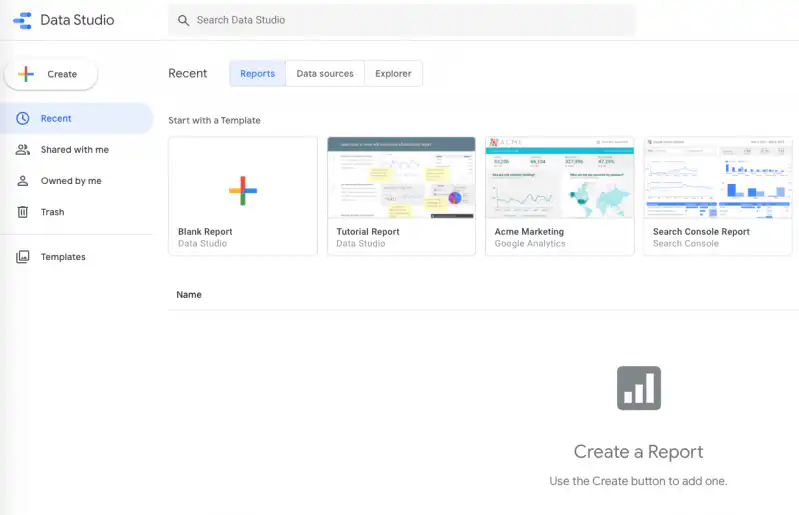
- The left-side menu allows you to create a report, data source, or explorer.
- The toolbar menu allows direct access to all reports, data sources, or created charts without having to edit the report itself.
- The top Search Data Studio bar lets you perform a quick search on reports by name.
- The Template Gallery offers templates from 8 different categories, including Google Sheets or Google Ads data sources.
- The report area is below the Template Gallery section, showcasing all your reports according to name, owner, or last opened.
How to create a report using Google Data Studio templates?
In this tutorial for beginners, we recommend trying out the main features of Google Data Studio by using their pre-built templates. As mentioned before, these templates are based on 8 different data source categories. Here, you’ll learn how to use a Google Sheet data source template.
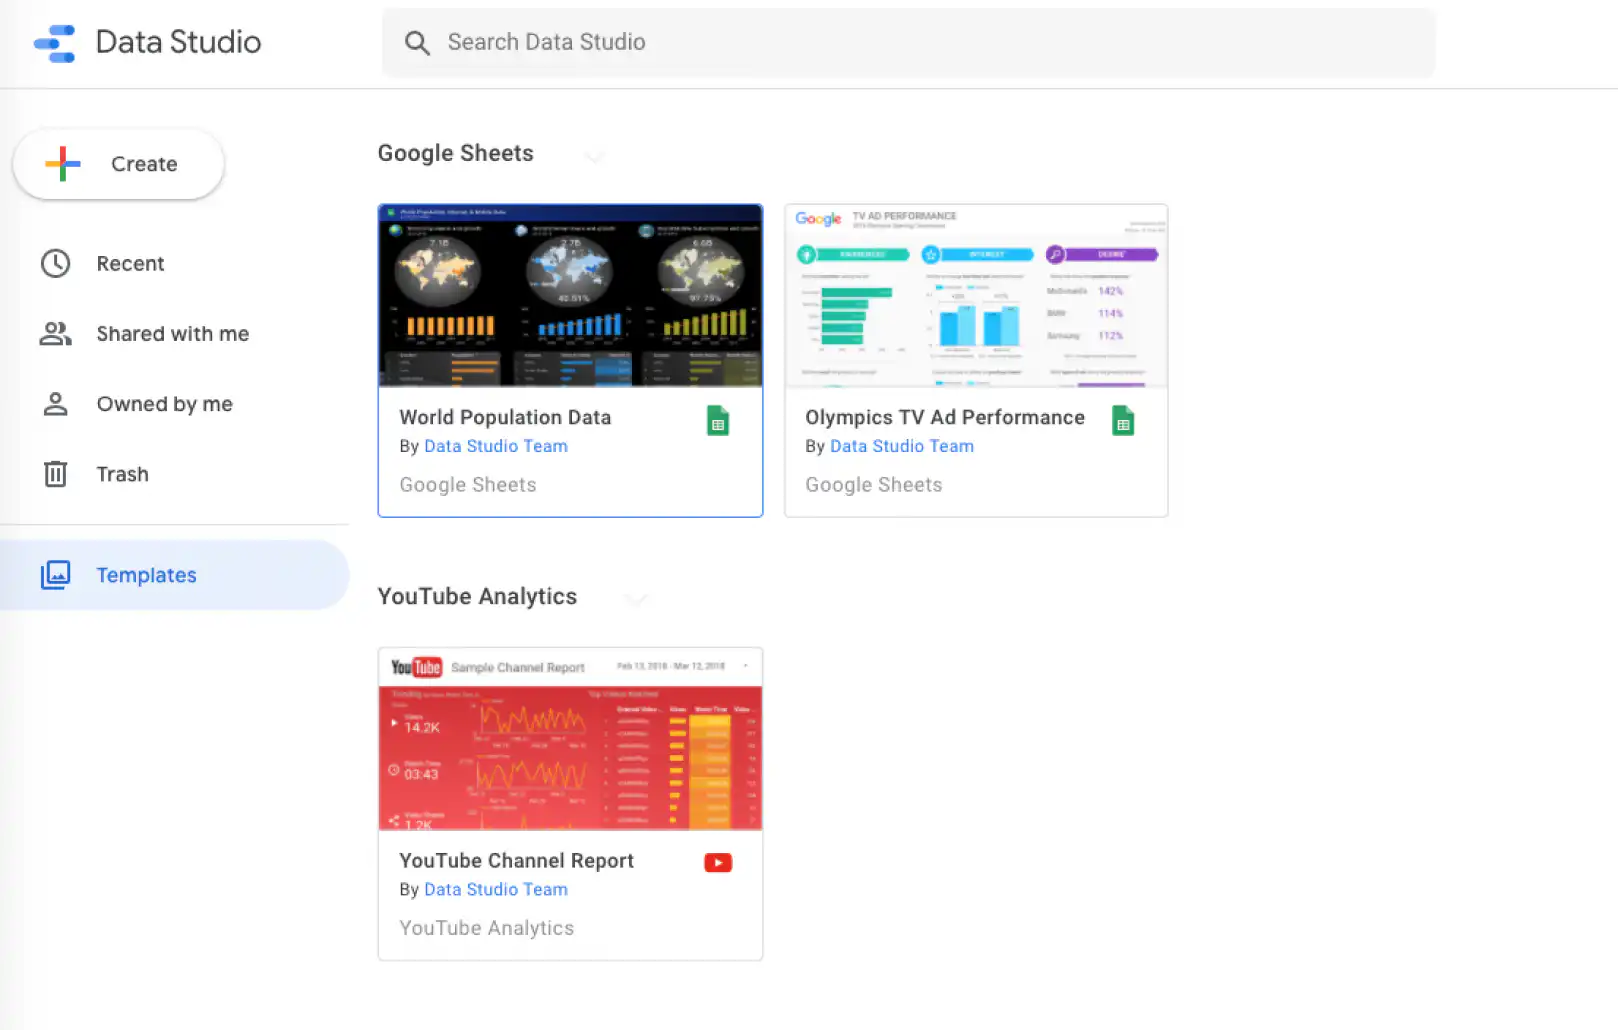
1. Go to “Templates”, on the left-side menu.
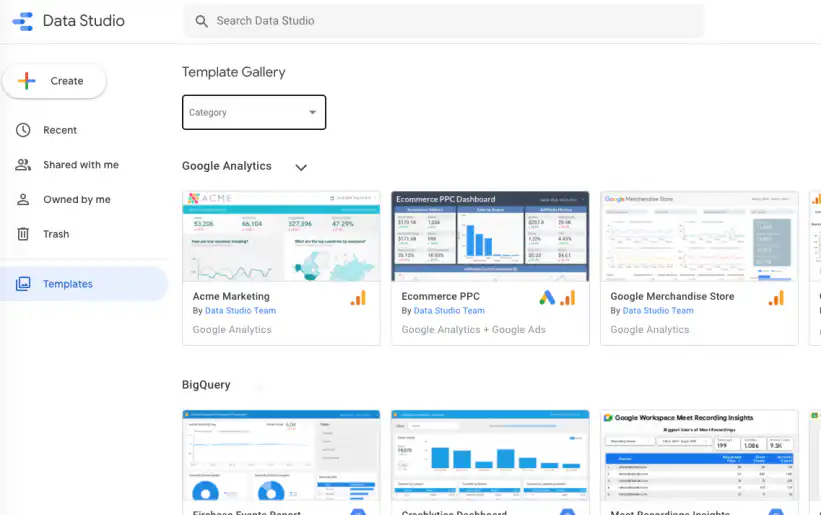
2. Click on the drop-down “Category” menu to select your preferred data source. Here, I will select “Google Sheets”.
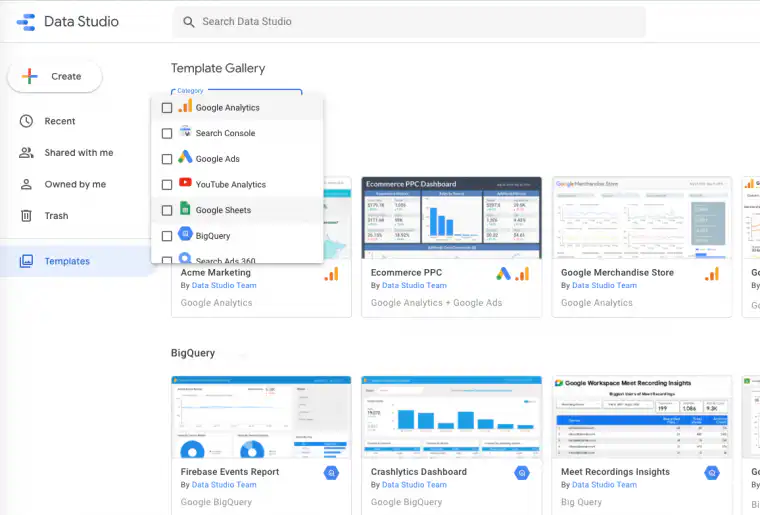
3. Google Data Studio offers two different templates based on Google Sheets. Simply double-click to access your preferred template. Here, we’ll select the “World Population Data” report, which already contains pre-existing data by Google.
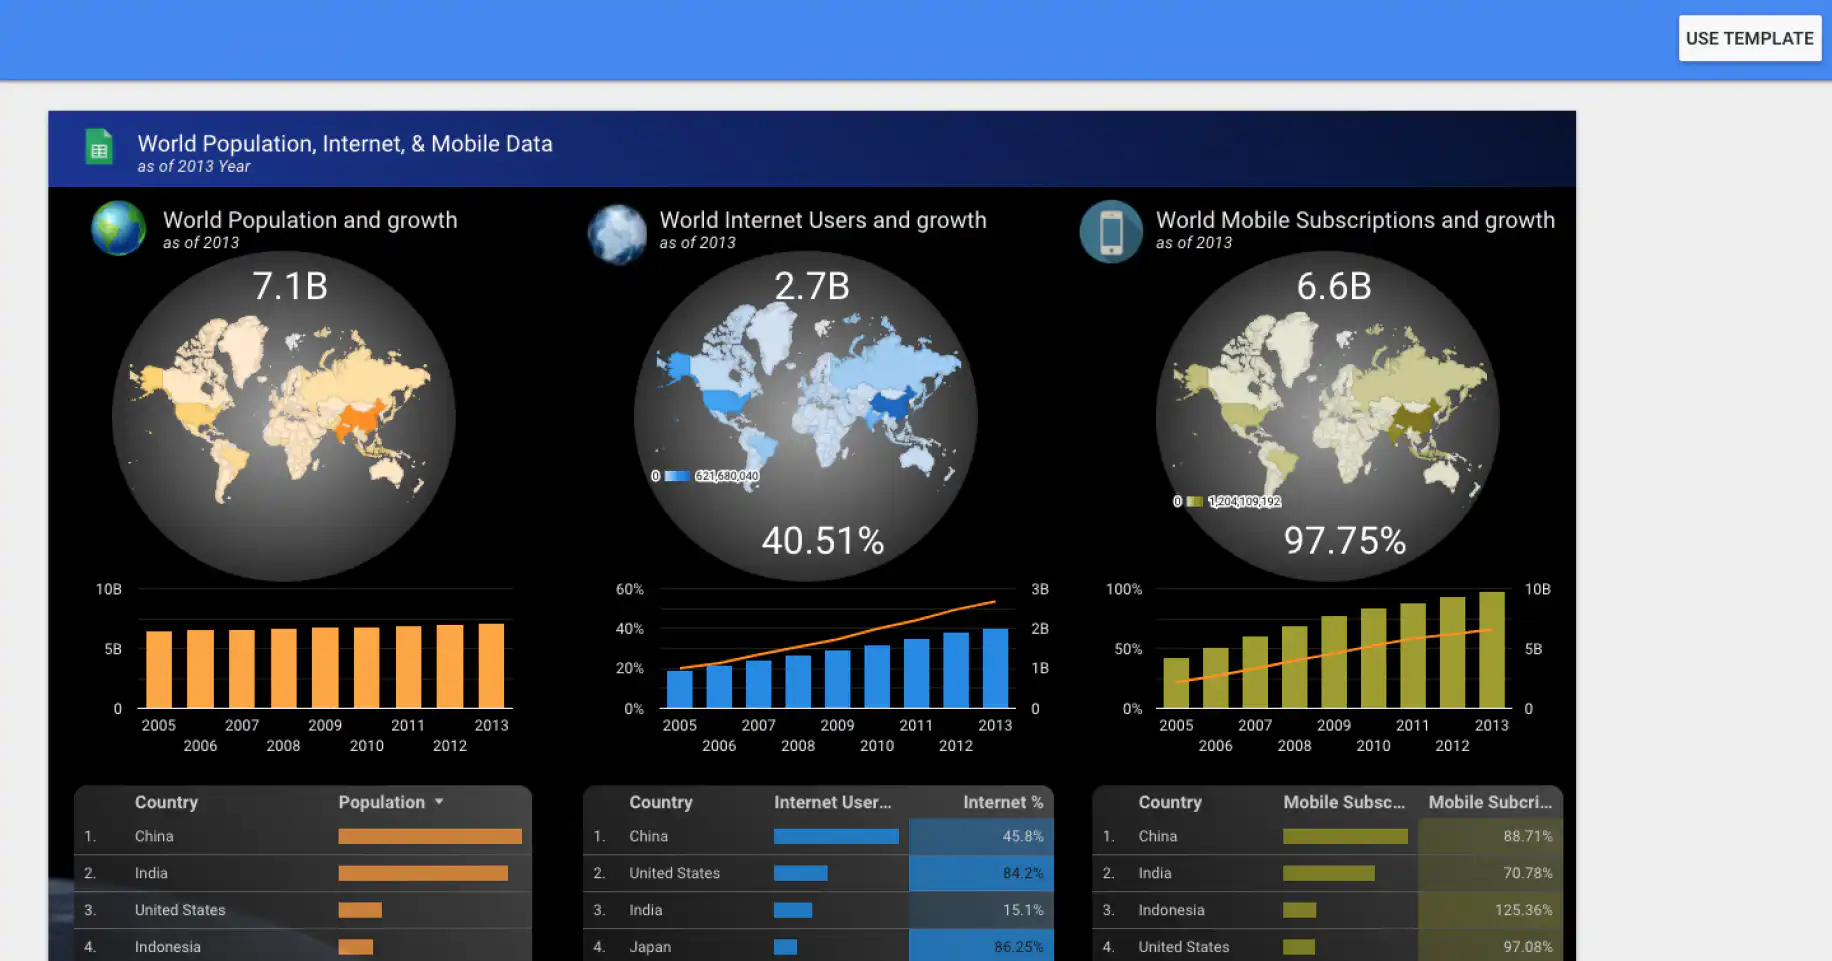
4. Click on “USE TEMPLATE” in the top-right corner to add to your Google Data Studio dashboard and start working.
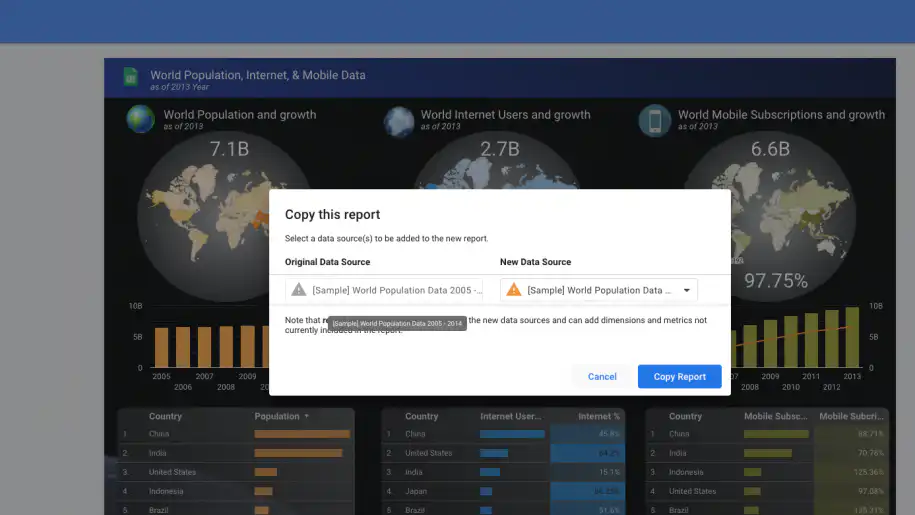
5. Click on “Copy Report” if you wish to add your “New Data Source” to the report. This simply means that you have the possibility to use the template as it is or merge your new data into it. Since I do not have any data in Google Sheets yet, I can copy this report template.
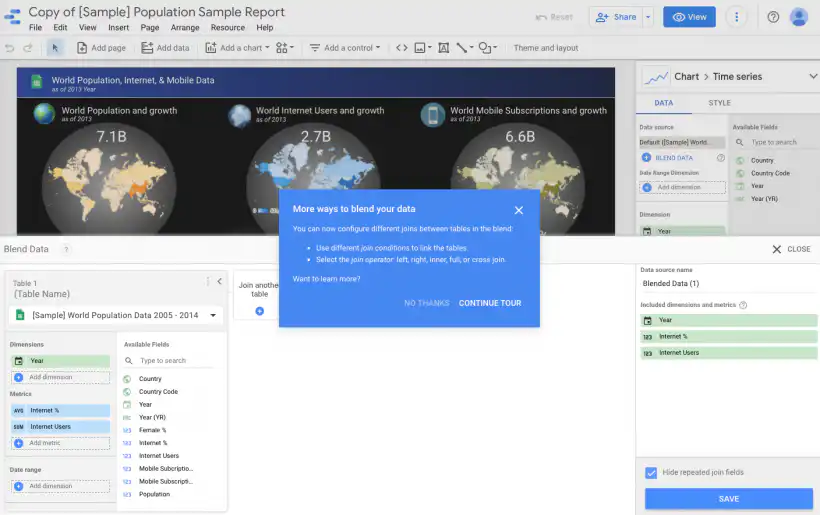
You always have the option of editing it later on, following the guided tour available within the template.
Now that we’ve seen how easy it is to create a report using one of the Google Data Studio templates, let’s explore the basics of creating a report by connecting to one of your data sources.
How to create a report connecting to a data source?
Before creating a report based on charts and other visual elements, you need to connect to a data source to display data. This is how you can connect to a data source.
1. Click on “Create” to the left-side menu and select “Report”.
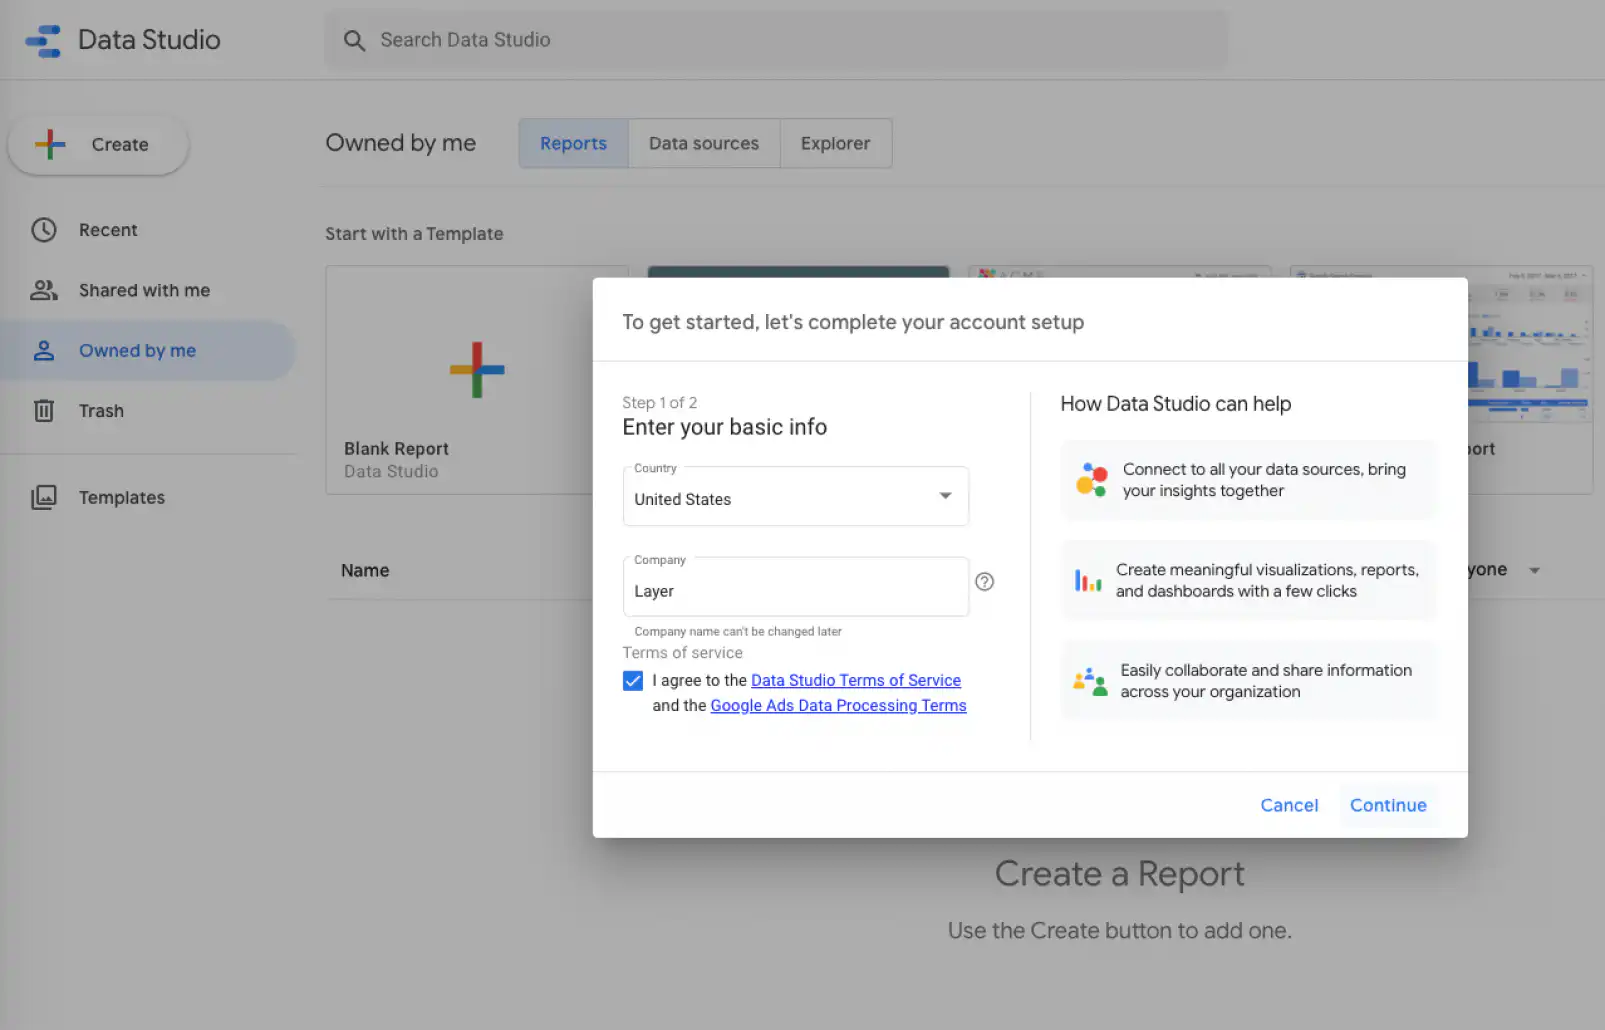
2. It will prompt you to enter basic information regarding your geographic location and company name. Here, I’ll select “United States” from the drop-down list and type your company name. Once you finish, click “Continue”.
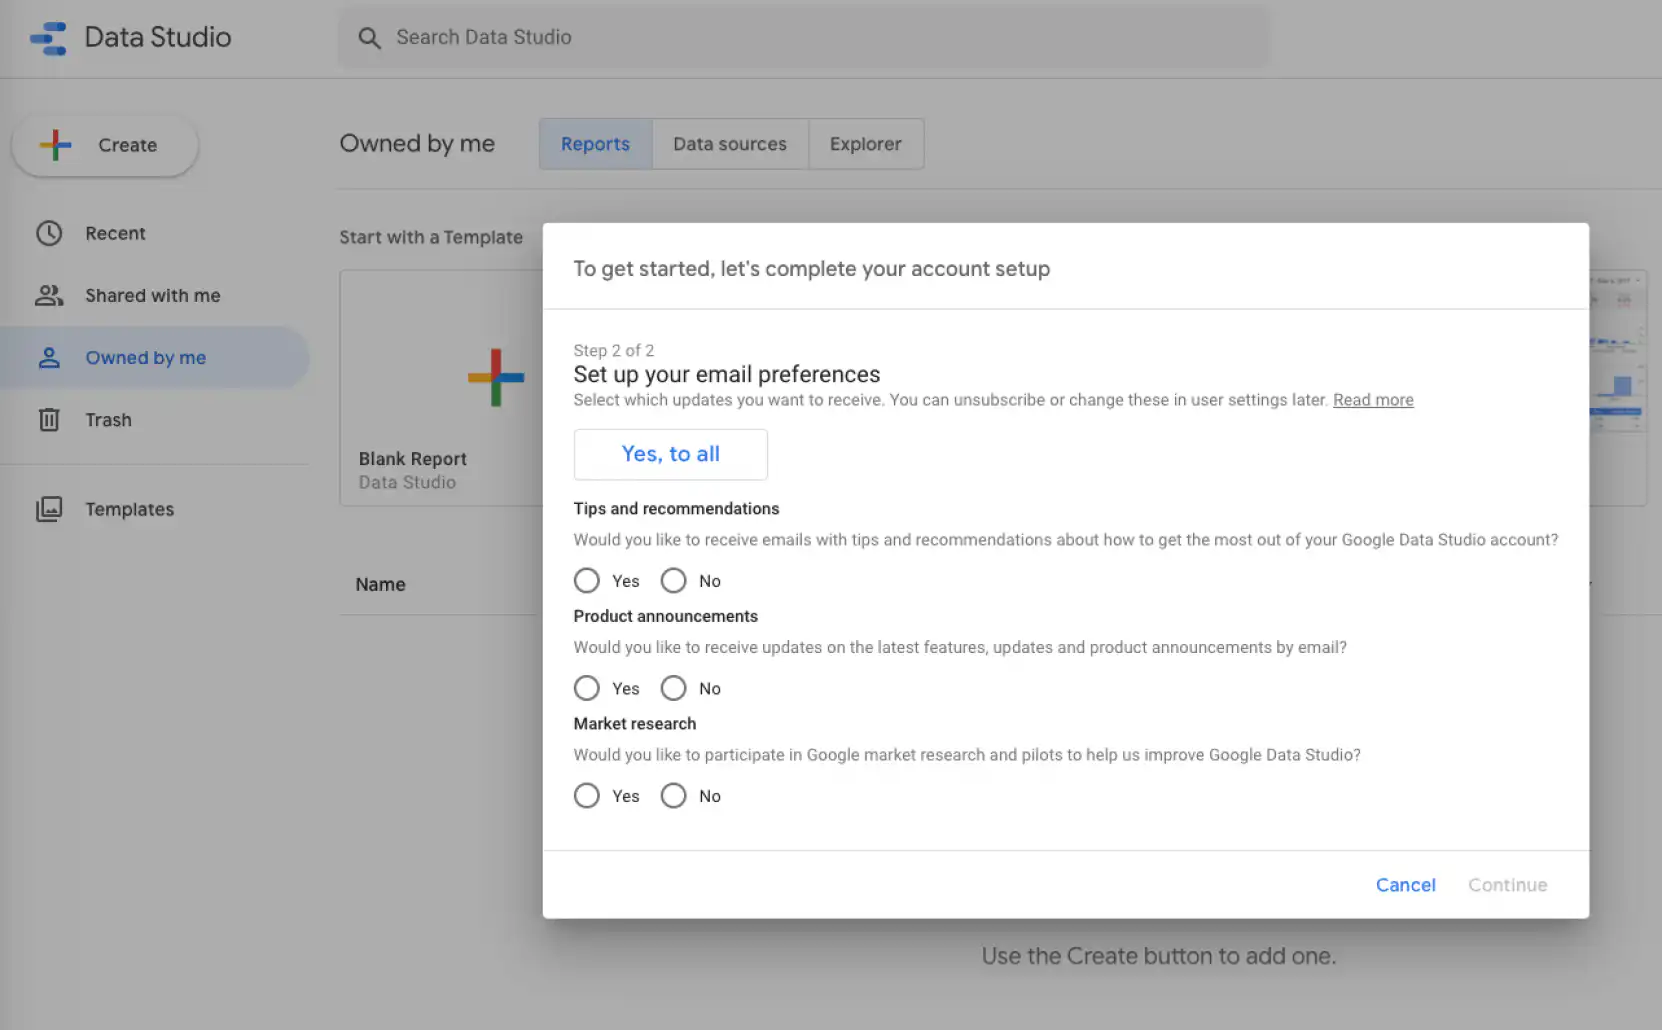
3. Finish your account setup.
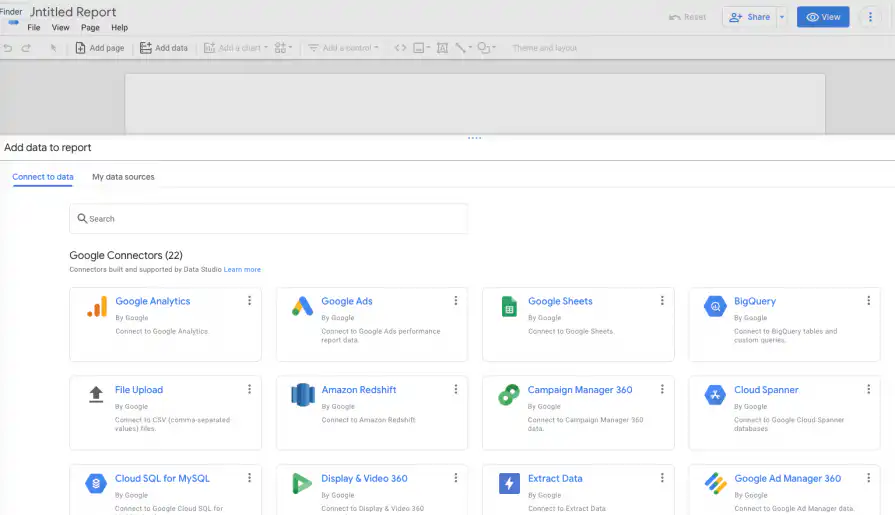
4. You can connect to up to 22 different data sources supported by Data Studio. Here, I’ll select “Google Sheets”.
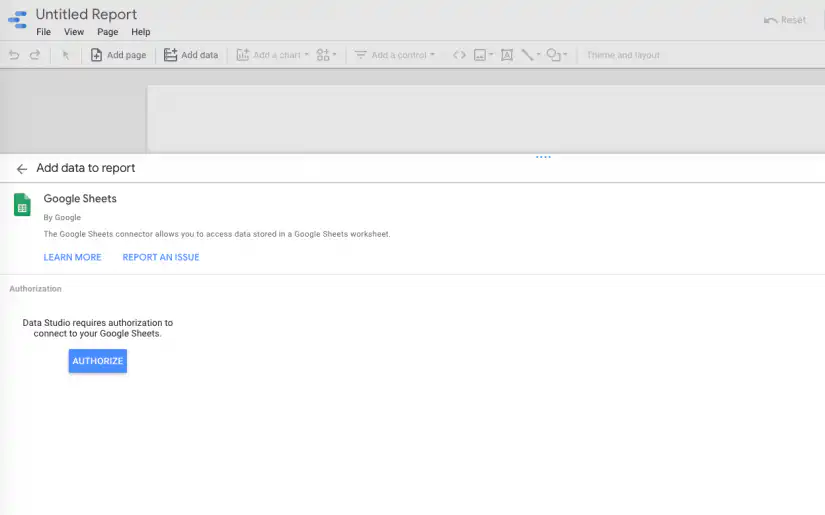
5. To access your Google Sheets data, you will need to click on “Authorize”.
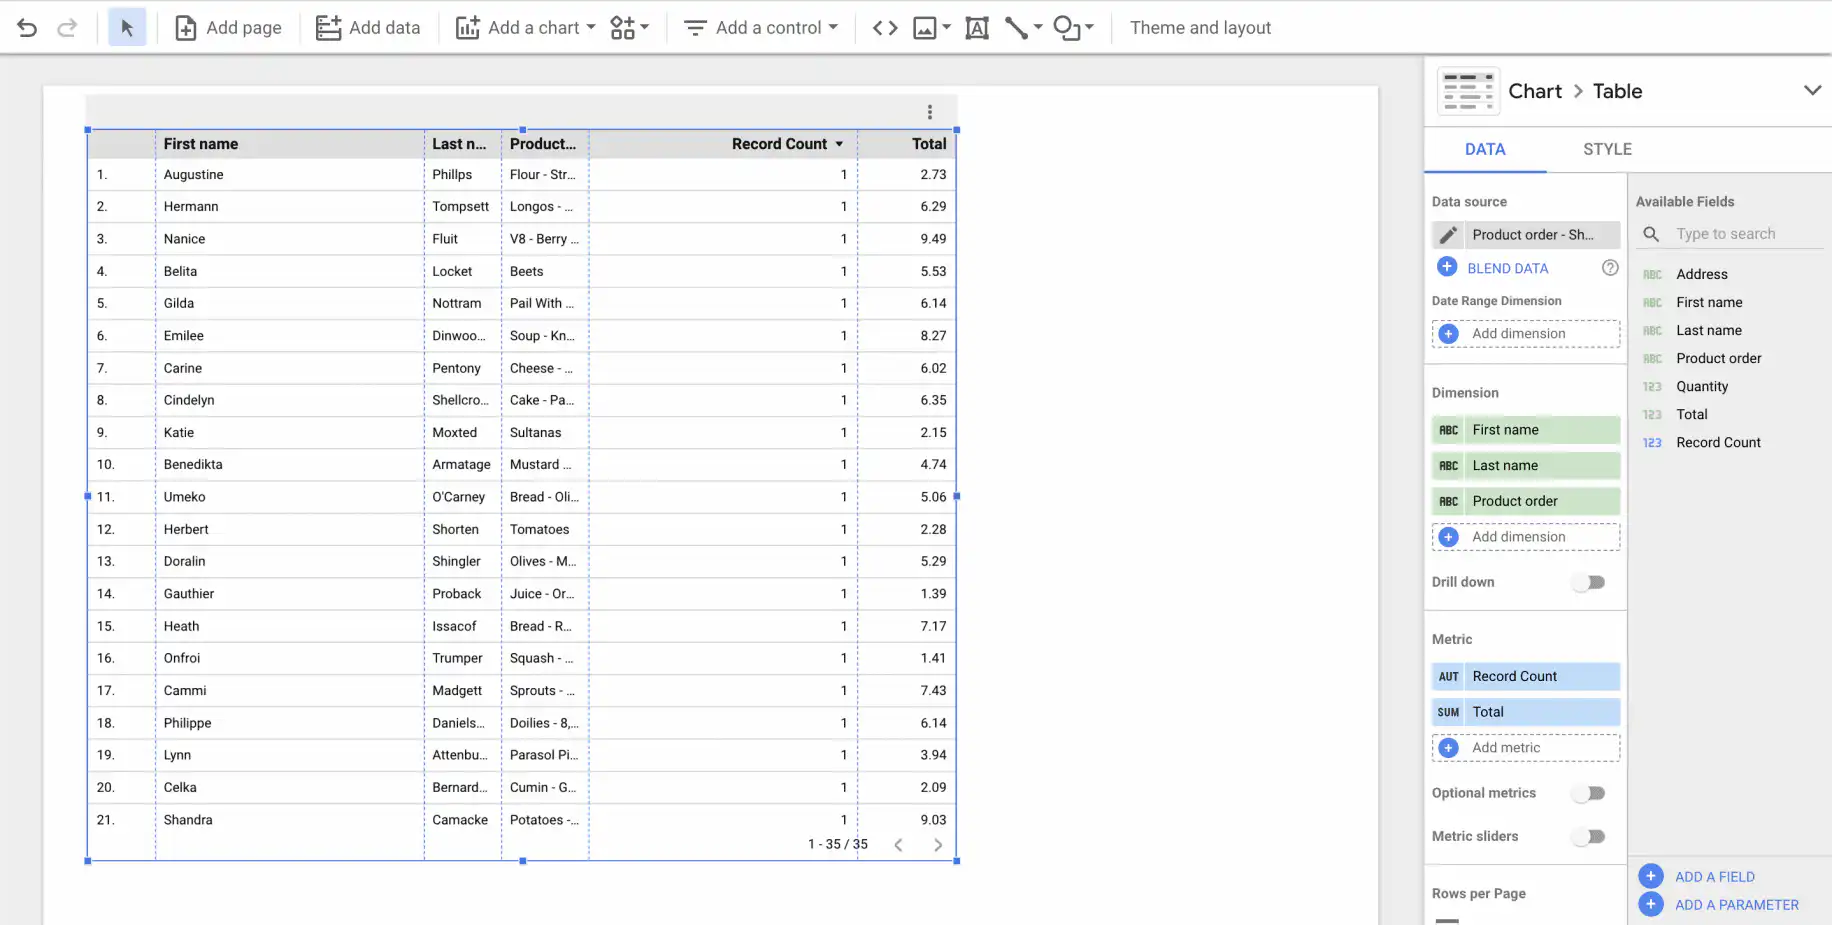
6. Your data should appear. Use the various Data Studio tools to edit your data to create a user-friendly, interactive report.
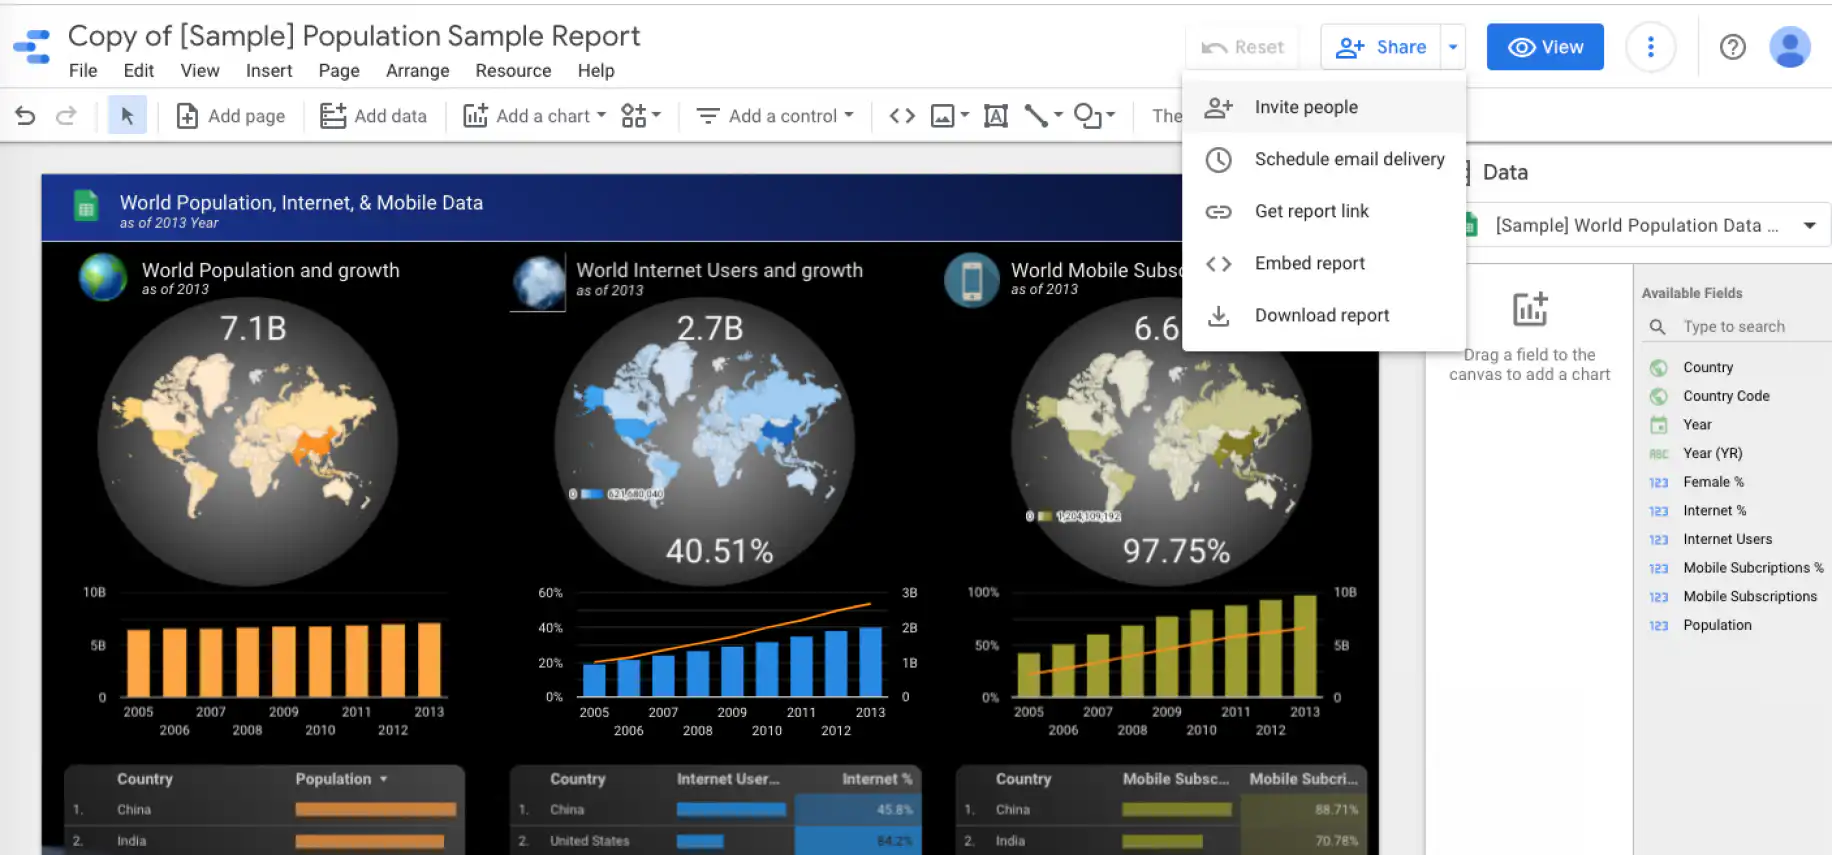
If you choose to “Invite people”, Google Data Studio allows you to control viewing and editing rights on various levels.
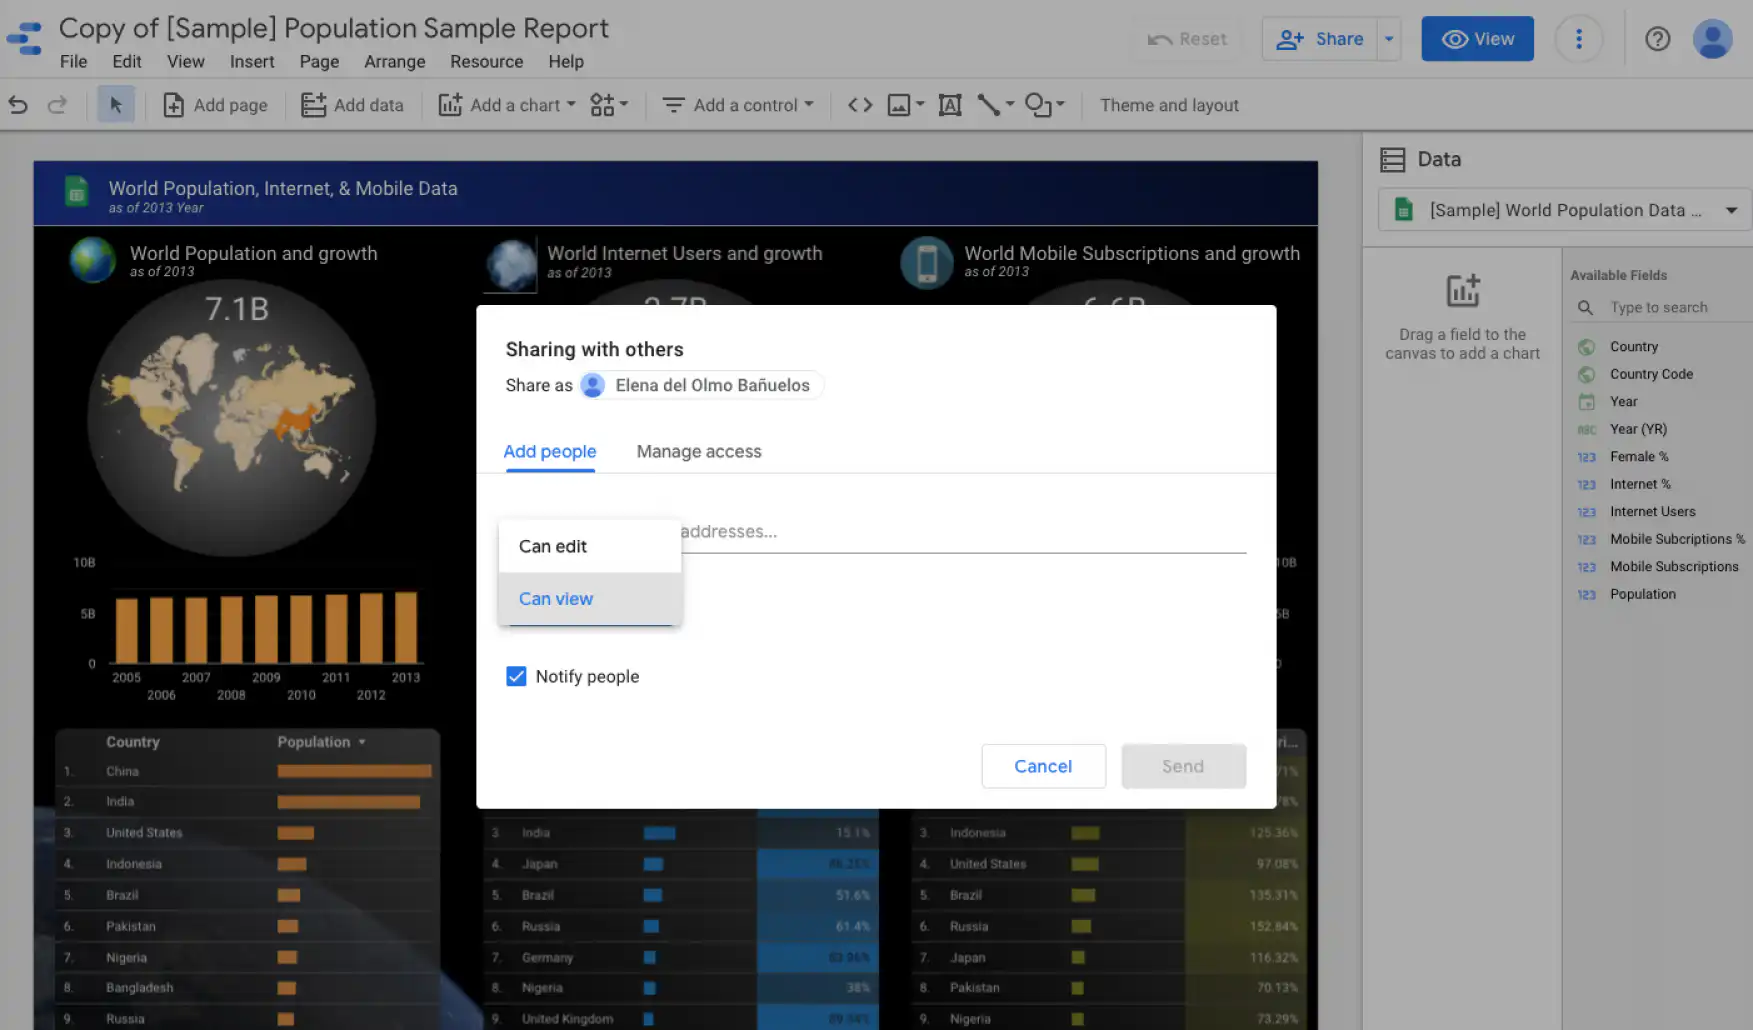
2. In the “Add people” tab, you can decide whether the recipient users “Can edit” or “Can view”, in addition to notifying them via email, so they immediately know a report has been shared with them.
3. For more advanced access rights, click on “Manage access”, next to the “Add people” tab. Then, click on the drop-down menu “Off – only specific people can access” to see the full range of access types.
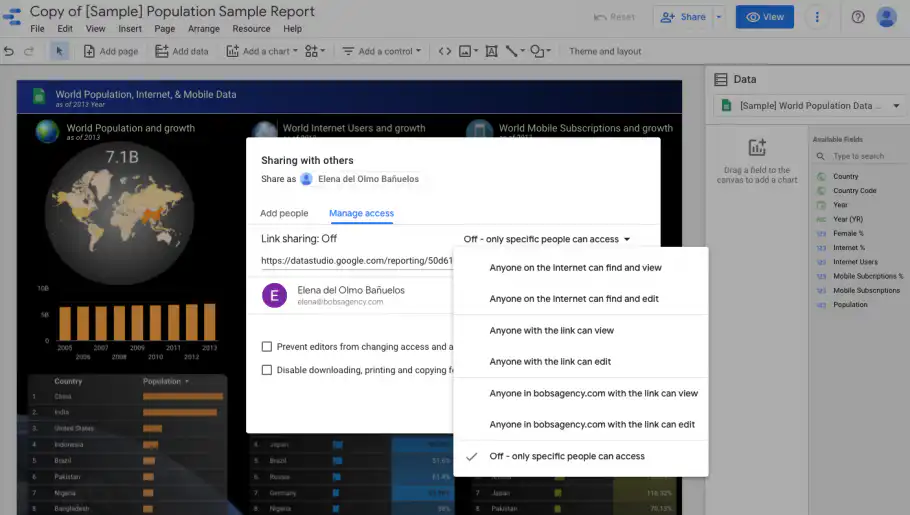
4. For more security or privacy, you can tick on both boxes below to “Prevent editors from changing access and adding new people” and “Disable downloading, printing, and copying for viewers”.
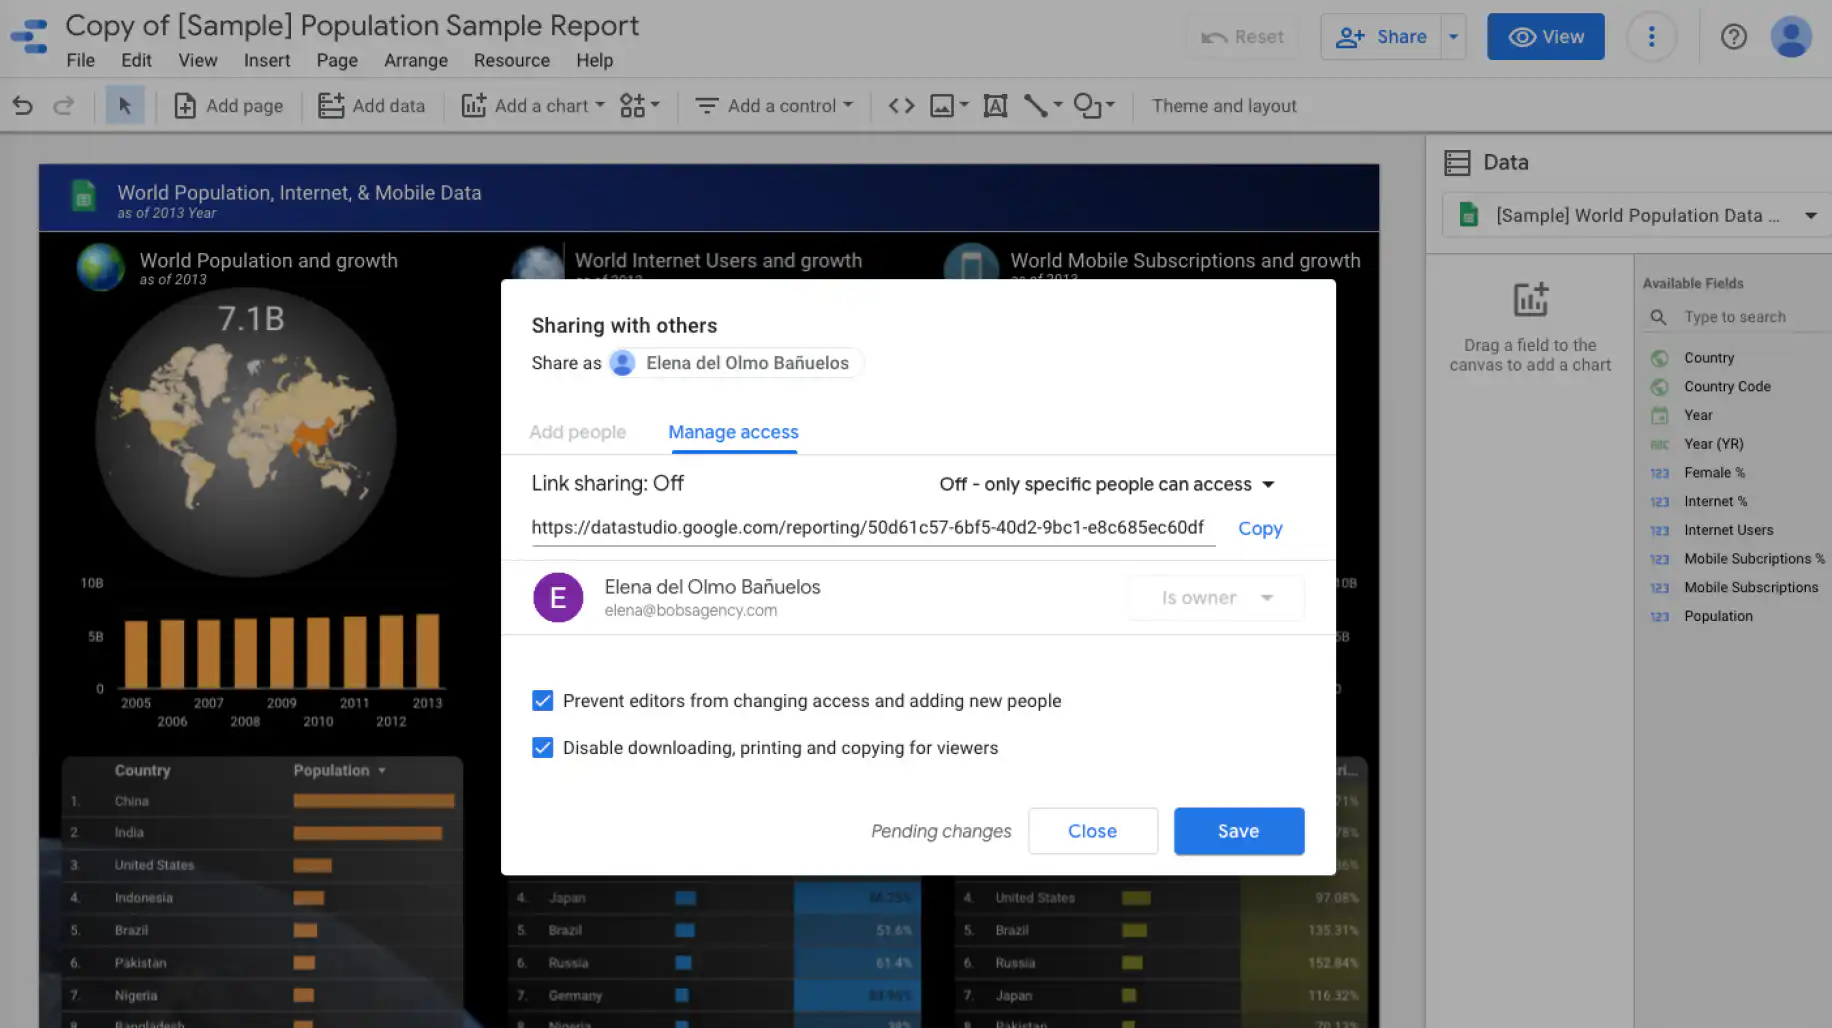
Google Data Studio allows you to adjust the security and protection levels for your data, which makes it an all-around collaborative tool for online data analysis and visualization.
Conclusion
As you can see, Google’s Data Studio is a fantastic tool that you can use for free in order to level up your reporting by connecting to all types of data sources and creating in-depth, interactive insights that you can easily share with others.
In this tutorial for beginners, we have given you a basic overview of Google Data Studio by explaining what it is, its main benefits, and how to use it. For a more advanced overview of this tool, take a look at the Looker Studio help center. If your data starts in Excel, read how to connect Excel to Google Looker Studio.
A report is only as current as the spreadsheets behind it. Sheetgo’s AI automations connect your Google Sheets and Excel files in an automated pipeline, so your Looker Studio reports read clean, up-to-date data.
Looking for more spreadsheet-related resources for beginners? Check out some of our other articles:

 English
 Español
 Português do Brasil
 Français