


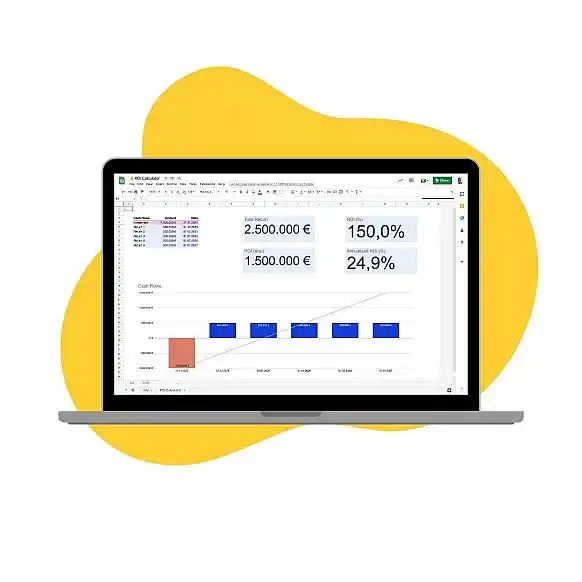

An ROI calculator template measures the success of an investment or business venture by comparing the return it brings in with the cost invested in it. You can build one in Google Sheets with a small cash flow table and four formulas.
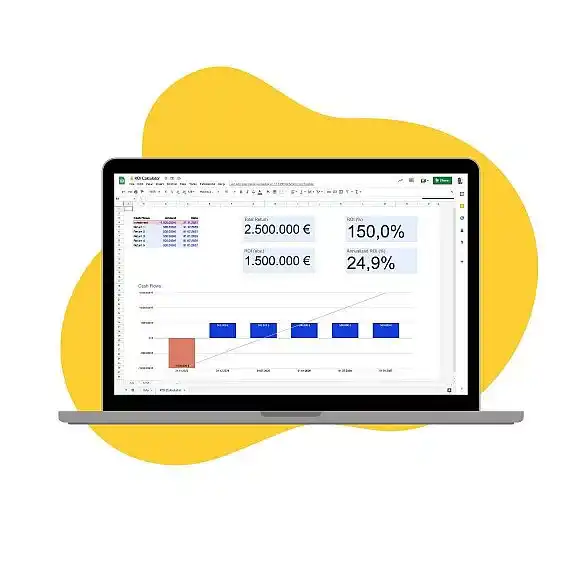
An ROI calculator template helps you:
- Define the initial investment and the returns with their respective dates.
- Keep the ROI figures and the cash flow chart up to date automatically.
What is ROI?
ROI stands for Return On Investment and is often used to measure the success of an investment or business venture. It measures the amount of return achieved relative to the cost invested in a project or activity.
How to calculate ROI?
The most common way to calculate ROI is to subtract the investment amount from the total benefits (income) and then divide it by the cost of investment. The resulting number is multiplied by 100 to get a percentage.
ROI formula
ROI = (Total return – Cost of investment) / Cost of investment x 100
For example, let’s say you invested $1,000 in an advertising campaign and earned $2,500 in sales as a result. To calculate your ROI, subtract your cost from your benefit ($2,500 – $1,000 = $1,500), then divide it by your cost ($1,500 / $1,000 = 1.5). Multiply that number by 100 for a final ROI of 150%. This means that for every dollar invested into this campaign, you received a return of $1.50.
How to build an ROI calculator template in Google Sheets
The ROI calculator in the screenshot above uses one cash flow table and four results. To build it, list your cash flows in columns A to C:
- Row 1: the headers Cash flows, Amount, and Date.
- Row 2: the initial investment, for example 1,000,000, and the date you made it.
- Rows 3 to 7: each return, for example five returns of 500,000, and the date you received it.
Then add these formulas next to the table:
- Total return: =SUM(B3:B7) returns 2,500,000.
- ROI (absolute): =SUM(B3:B7)-B2 returns 1,500,000.
- ROI (%): =(SUM(B3:B7)-B2)/B2 returns 1.5. Go to Format > Number > Percent to show it as 150%.
- Annualized ROI: =(SUM(B3:B7)/B2)^(1/YEARFRAC(C2,C7))-1 spreads the gain over the years between the investment and the last return. Over four years, an ROI of 150% works out to about 25.7% a year.
The annualized ROI works like the CAGR formula in Google Sheets, and it counts the whole return as if it arrived on the last date. When returns come in at different times, the XIRR formula in Google Sheets weighs each one by its date. XIRR needs the investment entered as a negative amount.
To chart the cash flows, select A1:B7 and go to Insert > Chart. A waterfall chart in Google Sheets shows the investment and each return as separate steps.
What is a good ROI percentage?
The answer to this question depends on the type of project or activity you are measuring. Generally speaking, a good ROI should be positive and above 0%. Of course, the higher your ROI, the better. Ultimately, it is essential to consider other factors, such as risk tolerance and overall business goals, when determining what constitutes a “good” ROI.
What is ROI in marketing?
In marketing, ROI is used to measure the effectiveness of different tactics and campaigns. It provides a way to quantify the results of an investment so that you can determine which activities are most beneficial for your company. It helps marketers set realistic goals and evaluate the success of their efforts. A marketing KPI template in Google Sheets can track ROI next to your other campaign metrics.
How to calculate ROI in marketing?
The process for calculating ROI in marketing is the same as it is for any other type of project. Subtract your total cost from your benefits and divide it by the cost. Multiply that number by 100 to get a percentage.
For example, let’s say you spend $2,000 on an email marketing campaign and earn $4,000 in sales as a result. To calculate your ROI, subtract your cost from your benefit ($4,000 – $2,000 = $2,000), then divide it by your cost ($2,000 / $2,000 = 1). Multiply that number by 100 for a final ROI of 100%. This means that for every dollar invested into this campaign, you received a return of $1.00.
What is ROI in real estate?
In real estate, ROI is used to measure the profitability of an investment property. It takes into account both the income generated from a property (in the form of rent or appreciation) and any associated expenses (such as taxes, insurance, and repairs). This helps investors determine which properties are most likely to generate a good investment return.
What is a good ROI for rental property?
The answer to this question varies depending on market conditions and property type. Generally speaking, a good ROI for rental property is considered to be anything above 8%. Of course, this number can vary significantly based on location and other factors. Experienced investors often aim for double-digit returns with their investments.
How to increase ROI?
The best way to increase ROI is by investing in tactics and activities most likely to generate a good return on investment. This means focusing on strategies and campaigns that are proven to be effective, such as email marketing, search engine optimization (SEO), pay-per-click (PPC) advertising, and social media marketing. Additionally, it is crucial to track and measure your results so that you can make adjustments as needed. This will help ensure you get the most out of your investments and maximize your ROI.
What is an ROI Google Sheets calculator template?
An ROI calculator Google Sheets template is a spreadsheet that can be used to calculate and analyze the ROI for a specific investment. This lets users quickly determine whether their investment will result in a positive return. The template also provides additional information, such as total revenue, costs associated with each investment, and estimated returns over time. With this data, investors can make more informed decisions about their assets and maximize their profits. By using this template, businesses can easily track and monitor their investments to identify trends and optimize them for the highest returns.
Why use an ROI Google Sheets calculator template?
Using a prebuilt ROI calculator template is beneficial because it saves time and energy. It takes the guesswork out of building your own spreadsheet and allows you to focus on the big picture – analyzing and increasing ROI. Additionally, many templates come with helpful features such as automatic calculations, charts, and graphs that make it easier to visualize and understand your data. With this information, you can make more informed decisions and maximize your ROI.
ROI is an essential metric for businesses because it helps them understand how effective their investments are in terms of results. Additionally, it allows companies to make informed decisions about future investments and budgeting by providing them with a clear understanding of the cost-benefit tradeoffs.
Overall, ROI is an easy-to-understand metric that helps businesses make smart investments and ensures they get the most out of their money. By understanding ROI, companies can make investments with confidence that they will be successful and profitable in the long run.
For more ready-made spreadsheets, see our top 5 free finance templates in Google Sheets and the cash flow template in Google Sheets. If the investment and return figures behind your ROI sit in different files, Sheetgo’s AI finance virtual employee can collect them into one spreadsheet and keep your ROI current.




 English
 Español
 Português do Brasil
 Français