




There are many financial metrics commonly used to evaluate a company’s financial performance. These cover all aspects of the company’s finances by focusing on different metrics. Leverage ratios are used to express a company’s financial stability in terms of its level of debt. This is especially important when looking for funding, whether it’s a loan from a bank or a venture capitalist.
In this article, you will learn about different types of leverage ratios and how to interpret them. You will also learn how to calculate the most common financial leverage ratios in Google Sheets. To learn more about financial ratios, take a look at these articles: Profitability Analysis and Budget Variance Analysis.
What is a leverage ratio?
Leverage ratio is an umbrella term for a series of financial ratios that express a company’s leverage with respect to liabilities, assets, and equity. These ratios can be useful indicators of a company’s ability to meet its financial obligations as long as they are assessed in context.
Generally speaking, there are three main types of leverage ratios: operating, financial, and combined. Operating leverage ratios focus on the ratio of fixed to variable costs, and financial leverage ratios focus on the extent to which the company is financed by debt or obligation.
What is a good total leverage ratio?
A ratio lower than 1 is generally considered good, although there are a few exceptions. The lower the value, the less likely the company will fail to meet financial responsibilities. A ratio above 1 is considered risky, but the context may justify it. If it climbs above 2, there may be cause for concern.
However, some of the ratios used to evaluate leverage are interpreted differently, as a higher ratio indicates an increased ability to pay back debt and other financial obligations.
There are multiple factors to be considered when analyzing leverage ratios. For instance, certain industries require a larger investment in equipment or material than others, so it’s important to use appropriate benchmarks. The ratios for startups and established businesses in the same industry are also likely to be very different, as the former has startup costs to cover.
How to calculate leverage ratios?
The calculations involved in finding leverage ratios are very simple, but there’s no excuse for doing it manually. Let spreadsheet software like Excel or Google Sheets take care of the arithmetic while you focus on analyzing and contextualizing the results.
As mentioned, there is a wide array to choose from regarding leverage ratios, but you’ll find a selection of frequently used ratios below. The first four express the relationship between the company’s total debt and various other metrics, like total assets, total equity, total capital, and Earnings Before Interest, Taxes, Depreciation, and Amortization (EBITDA). The last evaluates the relationship between the company’s assets and its equity.
Debt-to-assets ratio
This ratio expresses the company’s debt in relation to its assets. To calculate it, use the following formula:
debt-to-assets ratio = total debt / total assets
Debt-to-equity ratio
Another ratio of interest is the amount of debt relative to the company’s total equity. Our guide to the debt-to-equity ratio covers it in more detail. Use the following formula to calculate it:
debt-to-equity ratio = total debt / total equity
Debt-to-capital ratio
By dividing debt by the sum of debt and equity, you get the company’s debt-to-capital ratio. Use this formula to calculate it:
debt-to-capital ratio = total debt / (total debt + total equity)
Debt-to-EBITDA ratio
This ratio expresses debt in relation to Earnings Before Interest, Taxes, Depreciation, and Amortization (EBITDA). Use the following formula to calculate it:
debt-to-EBITDA ratio = total debt / EBITDA
Asset-to-equity ratio
This ratio expresses the proportion of the company’s assets that is funded by shareholder equity. To calculate it, use the following formula:
asset-to-equity ratio = total assets / total equity
How to calculate leverage ratios in Google Sheets?
Financial leverage ratios can be calculated easily with Google Sheets. Whether you’re doing internal analysis or you want to present a proposal for funding, you’ll need to provide a realistic picture of your company’s ability to meet financial obligations.
It’s common for the data you need to be spread out over multiple spreadsheets in various formats. Additionally, collaboration and synchronization can be problematic when working with a team. With Sheetgo’s AI automations, you can connect those spreadsheets and keep them in sync, so every ratio uses the latest figures. For recurring finance work, Sheetgo’s AI finance virtual employee can collect the figures and keep your ratios up to date.
1. In Google Sheets, set up a table for the required data. You can find the information you need in the company’s balance sheet and income statements.
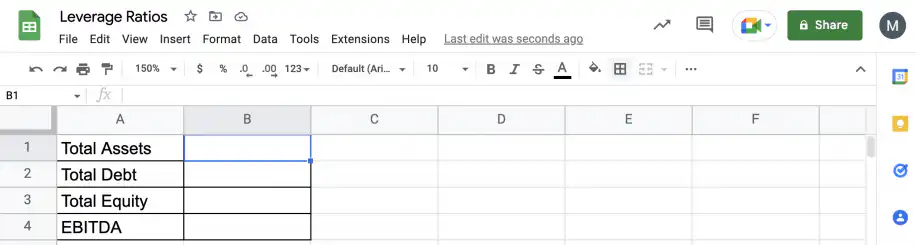
2. Using cell references, type in the formula for the leverage ratios you want. To calculate the debt-to-assets ratio, simply select the cell with the value for “Total Debt” and divide by the cell with the value for “Total Assets”.
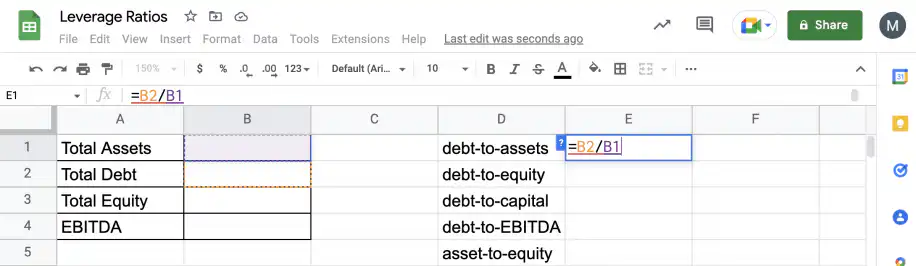
3. Add the formulas for any other ratios you need to calculate. You can save this as a template and update the relevant fields as needed. You can safely ignore the errors, as they will disappear once you add values.
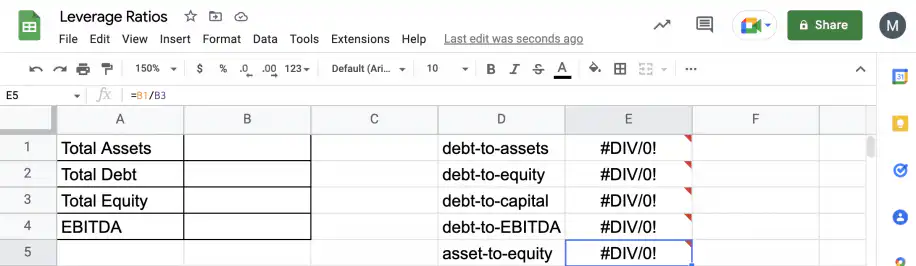
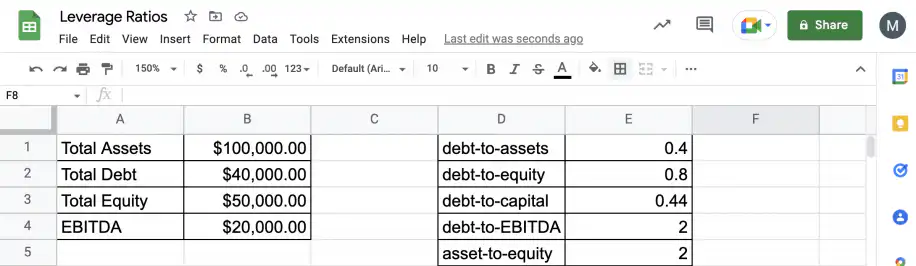
4. That’s it. Add values to the table to see the corresponding leverage ratios.
Examples of leverage ratios
- debt-to-assets ratio = total debt / total assets = $40,000 / $100,000 = 0.4
- debt-to-equity ratio = total debt / total equity = $40,000 / $50,000 = 0.8
- debt-to-capital ratio = total debt / (total debt + total equity) = $40,000 / ($40,000 + $50,000) = 0.44
- debt-to-EBITDA ratio = total debt / EBITDA = $40,000 / $20,000 = 2
- asset-to-equity ratio = total assets / total equity = $100,000 / $50,000 = 2
Conclusion
As you have seen, financial leverage ratios can provide useful information about a company’s ability to meet financial responsibilities. However, it’s important to analyze them in context, using suitable examples for comparison. Additionally, you need to remember that while most of the debt-related ratios are considered better when they have low values, there are others for which higher values are preferable.
You now know about leverage ratios and how to interpret them, as well as how to calculate them. You also know how to use Google Sheets to calculate the most commonly used financial leverage ratios. To learn more about related financial analyses, take a look at the following articles:


 English
 Español
 Português do Brasil
 Français