


Standard deviation is one of the main measures of dispersion in a dataset. It shows the spread of the data by calculating the average distance of values to the dataset’s mean, regardless of whether they are above or below it. In other words, a low standard deviation indicates that most of the values are close to the mean or average of the dataset, while a high value indicates that the values are spread out over a wider range. The formula used to calculate it is straightforward, but if you use a spreadsheet program like Microsoft Excel or Google Sheets, there are many built-in functions that will calculate it for you. In Google Sheets, the main one is STDEV.
In this guide, you will learn how to calculate standard deviation and review all the built-in functions available to calculate it for you in Google Sheets. You will learn the differences between the multiple versions of the STDEV function, like STDEVP, STDEVA, STDEVPA, DSTDEV, and DSTDEVP. You have step-by-step instructions on how to use the functions with different types of data and in combination with other functions.
How to find standard deviation in Google Sheets
To calculate the standard deviation of a sample, you can use the STDEV function. Values can be typed or in the form of cell references. The function can be used on single values or arrays. When using single values, there must be a minimum of two. The next section covers its exact syntax.
1. Add function
Type the STDEV function in an empty cell.
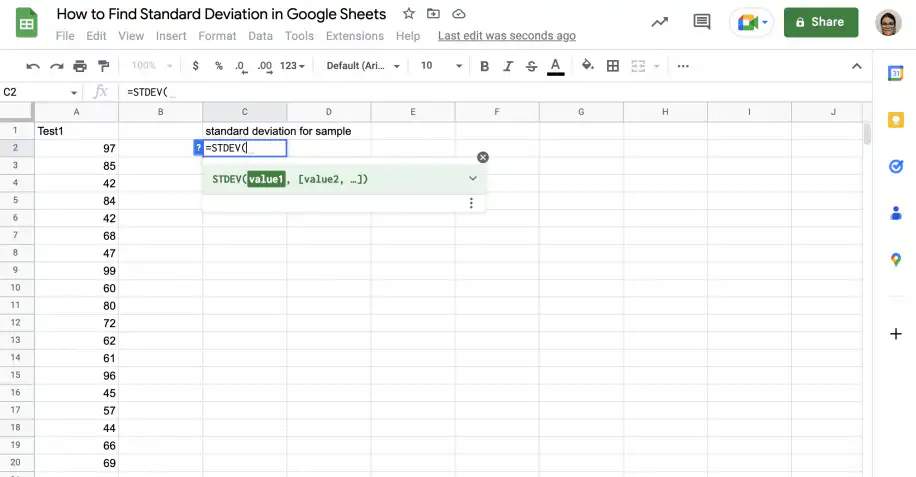
2. Select dataset
Type the values in your dataset, separated by commas. Alternatively, select the cells containing the values.
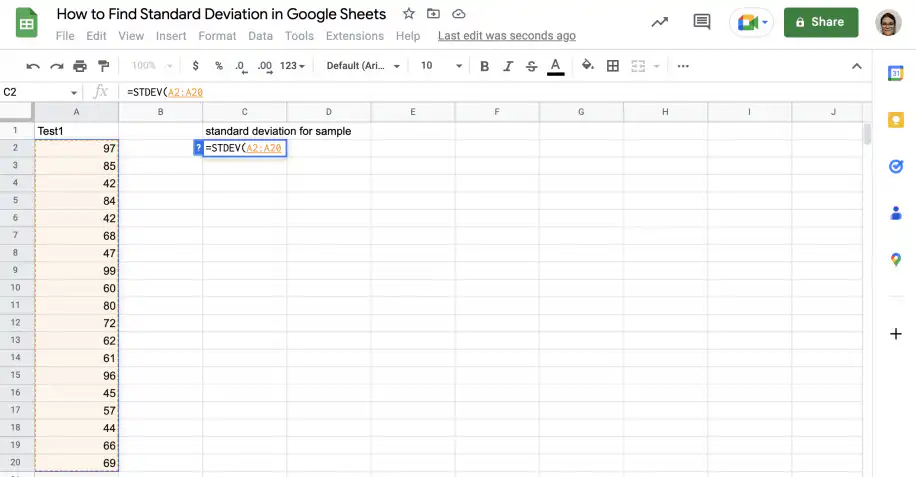
3. Get standard deviation
Close the parenthesis and press ‘Enter’.
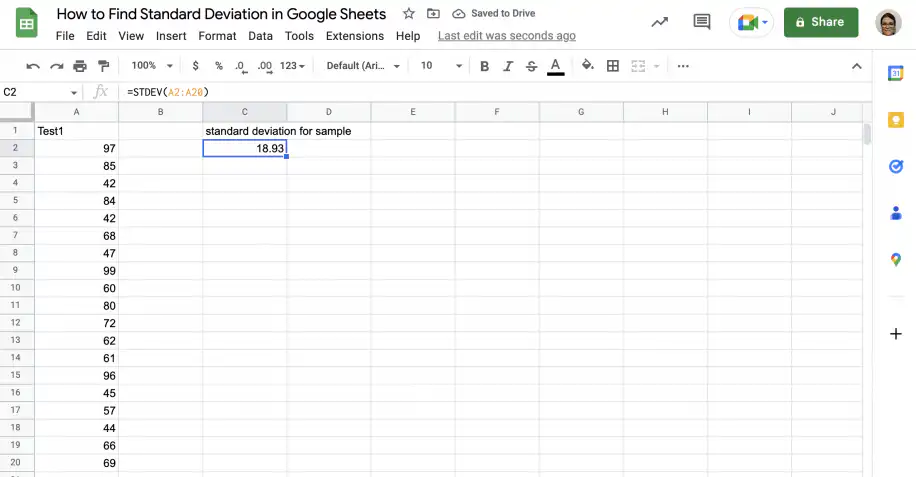
The standard deviation formula in Google Sheets
To calculate the standard deviation of a dataset, you need to sum the square of the differences between each value and the mean, then divide by the size of the dataset (population) or the size of the dataset minus one (sample). Finally, take the square root of the result.
Population standard deviation formula
The formula used to calculate the standard deviation for a population is as follows:
σ = √Σ( xi – μ)^2/N
- σ = standard deviation of population
- Σ = sum
- xi = each value in dataset
- μ = population mean
- N = size of population
Sample standard deviation formula
To calculate the standard deviation for a sample of the population, use the following formula:
s = √Σ( xi – x̄)^2/(n-1)
- s = standard deviation of sample
- Σ = sum
- xi = each value in sample
- x̄ = sample mean
- n = size of sample
You don’t need to work through these by hand. In Google Sheets, STDEV applies the sample formula and STDEVP applies the population formula. This is the syntax of STDEV:
- value1 – is the first value or reference to the range of the dataset.
- value2, … – [ OPTIONAL ] – are additional values or references to ranges that contain values you want to include in the dataset.
Four ways to enter values in STDEV
STDEV accepts typed numbers, cell references, ranges, or a mix of them. The snapshot below runs the same ten values through each option.

The first thing you’ll notice is that in all four instances above, you get the same result. This makes sense, since I’m using the same data each time. The point here is to demonstrate the different ways you can input data into the STDEV function.
The first example takes direct numeric values and returns the calculated standard deviation. The second demonstrates that the STDEV formula is also capable of using references to cells that store numbers. In the third example, instead of sending multiple values or references, I’ve entered a single range that contains all the values from A2 through A11. This is the easiest method, since you only have to input a single range. In the final example, I typed a combination of direct numeric values and range references.
As you can see, regardless of the approach you take with the formula, the output will be the same.
Notes
- STDEV returns an error if you type text directly as an argument. Text and empty cells inside a referenced range are ignored. To count text as zero, use STDEVA.
- This formula calculates the standard deviation for a sample. If you need to do it for a population instead, you can use the STDEVP formula.
- The formula may return a #DIV/0! error if there are not at least two value arguments.
- If you’re familiar with statistics, you’ll know that standard deviation is just the square root of the variance, another important metric in statistics. You can calculate this using the VAR formula in Google Sheets. The image below illustrates this concept.

Sample vs population standard deviation: STDEV, STDEVA, STDEVP, and STDEVPA
The STDEV function calculates the standard deviation for datasets that constitute a sample of the population. STDEVP, however, calculates it for the population. The difference is in the formula’s denominator: N is used for a population, and n-1 for a sample.
The choice between the two depends on the type of dataset you’re working with. If you have access to the data for the entire population, which isn’t often the case, you should use the population version of the formula. If you have a sample of the population, you should use the sample version. In addition to providing both formulas as built-in functions (STDEV for samples and STDEVP for populations), Google Sheets features some additional versions, all with the same syntax and parameters.
For example, both formulas are also available as database functions: DSTDEV and DSTDEVP. Like DSUM, these functions work with data structured as database-like tables.
Finally, there is another version of these formulas to be used on datasets that may contain text values in some cells, such as a dash or other characters to represent zero. The STDEVA and STDEVPA functions assume that cells with text are equal to a value of 0.
Below, you have examples using STDEV vs. STDEVP, STDEVA vs. STDEVPA, and DSTDEV vs. DSTDEVP to find the standard deviation for different datasets.
STDEV vs. STDEVP
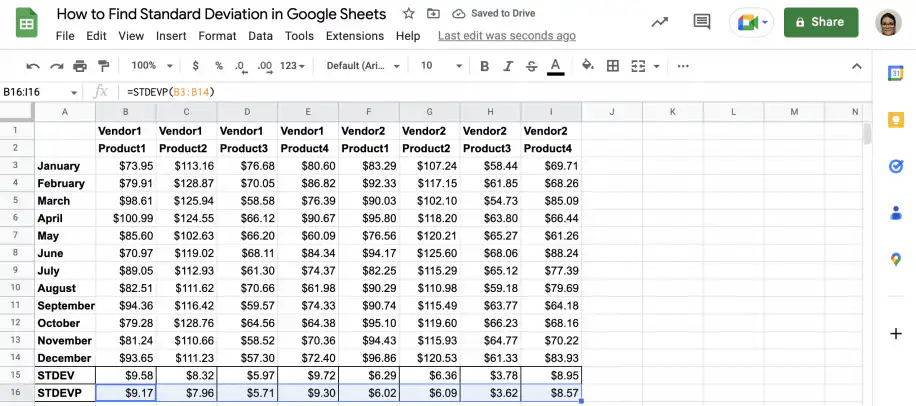
In the example below, I will calculate the population and sample standard deviation for the same dataset to illustrate the difference. The dataset contains changes in price over a year for two vendors selling four different products. I will calculate the standard deviation for each product and vendor.
1. In an empty cell, type the STDEV function and select the first set of values.
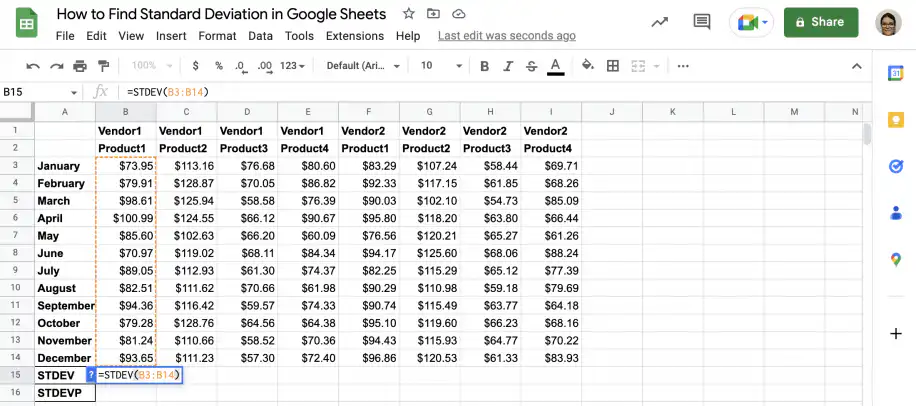
2. Press ‘Enter’ to see the result. Grab the fill handle and drag it right to the last column.
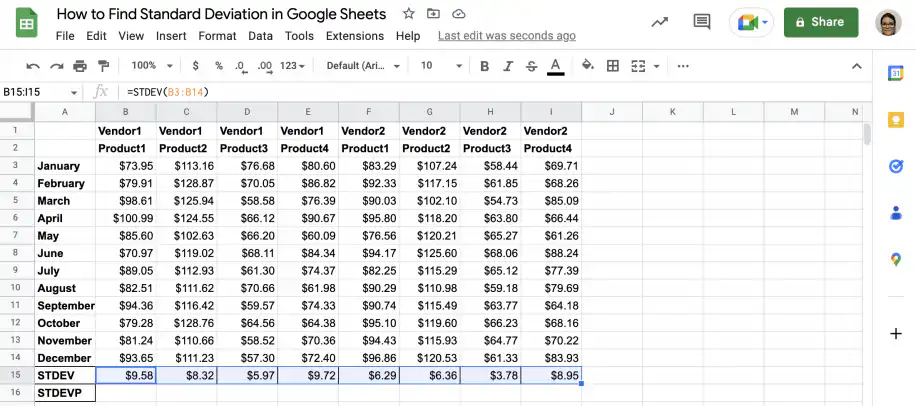
3. In the row beneath, I have repeated steps 1 and 2 with the STDEVP function to see the difference.
STDEVA vs. STDEVPA
Below, I will calculate the standard deviations for three tests. Since some of the cells contain dashes to indicate that the student missed the test, I will use STDEVA and STDEVPA so they are converted to zeroes.
1. In an empty cell, type the STDEVA function and select the first set of values.
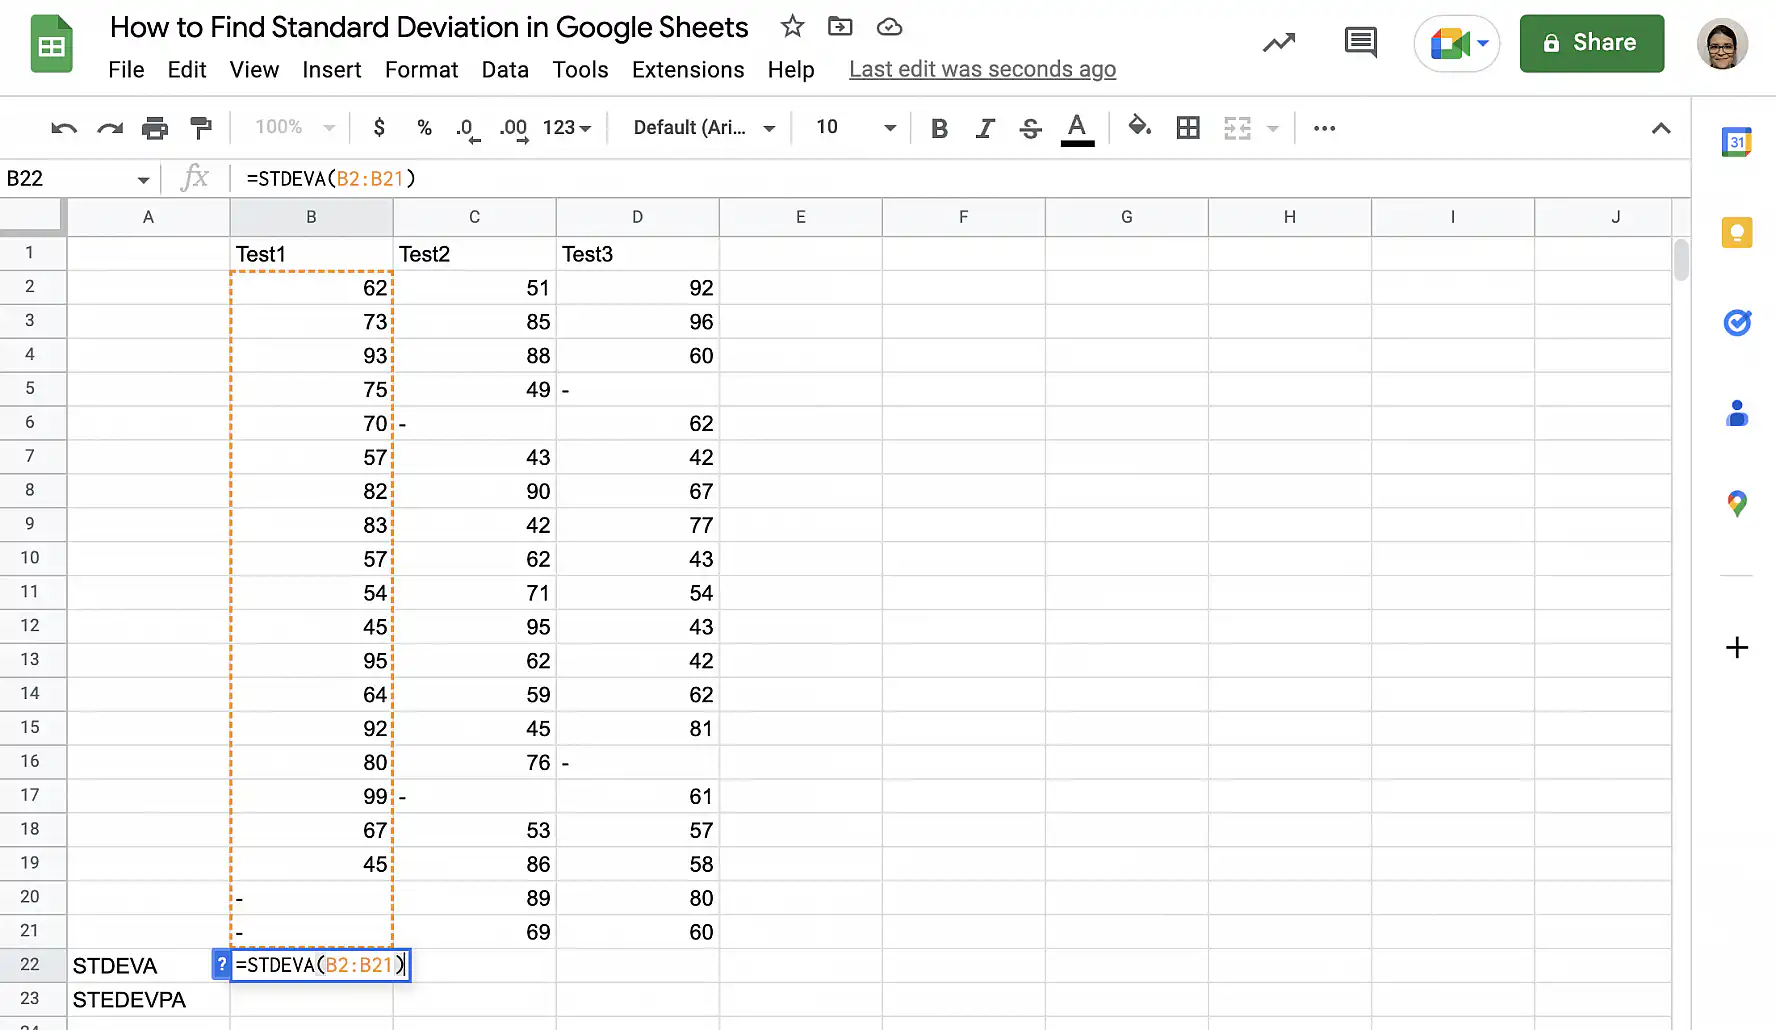
2. Press ‘Enter’ to see the result. Grab the fill handle and drag it right to the last column.
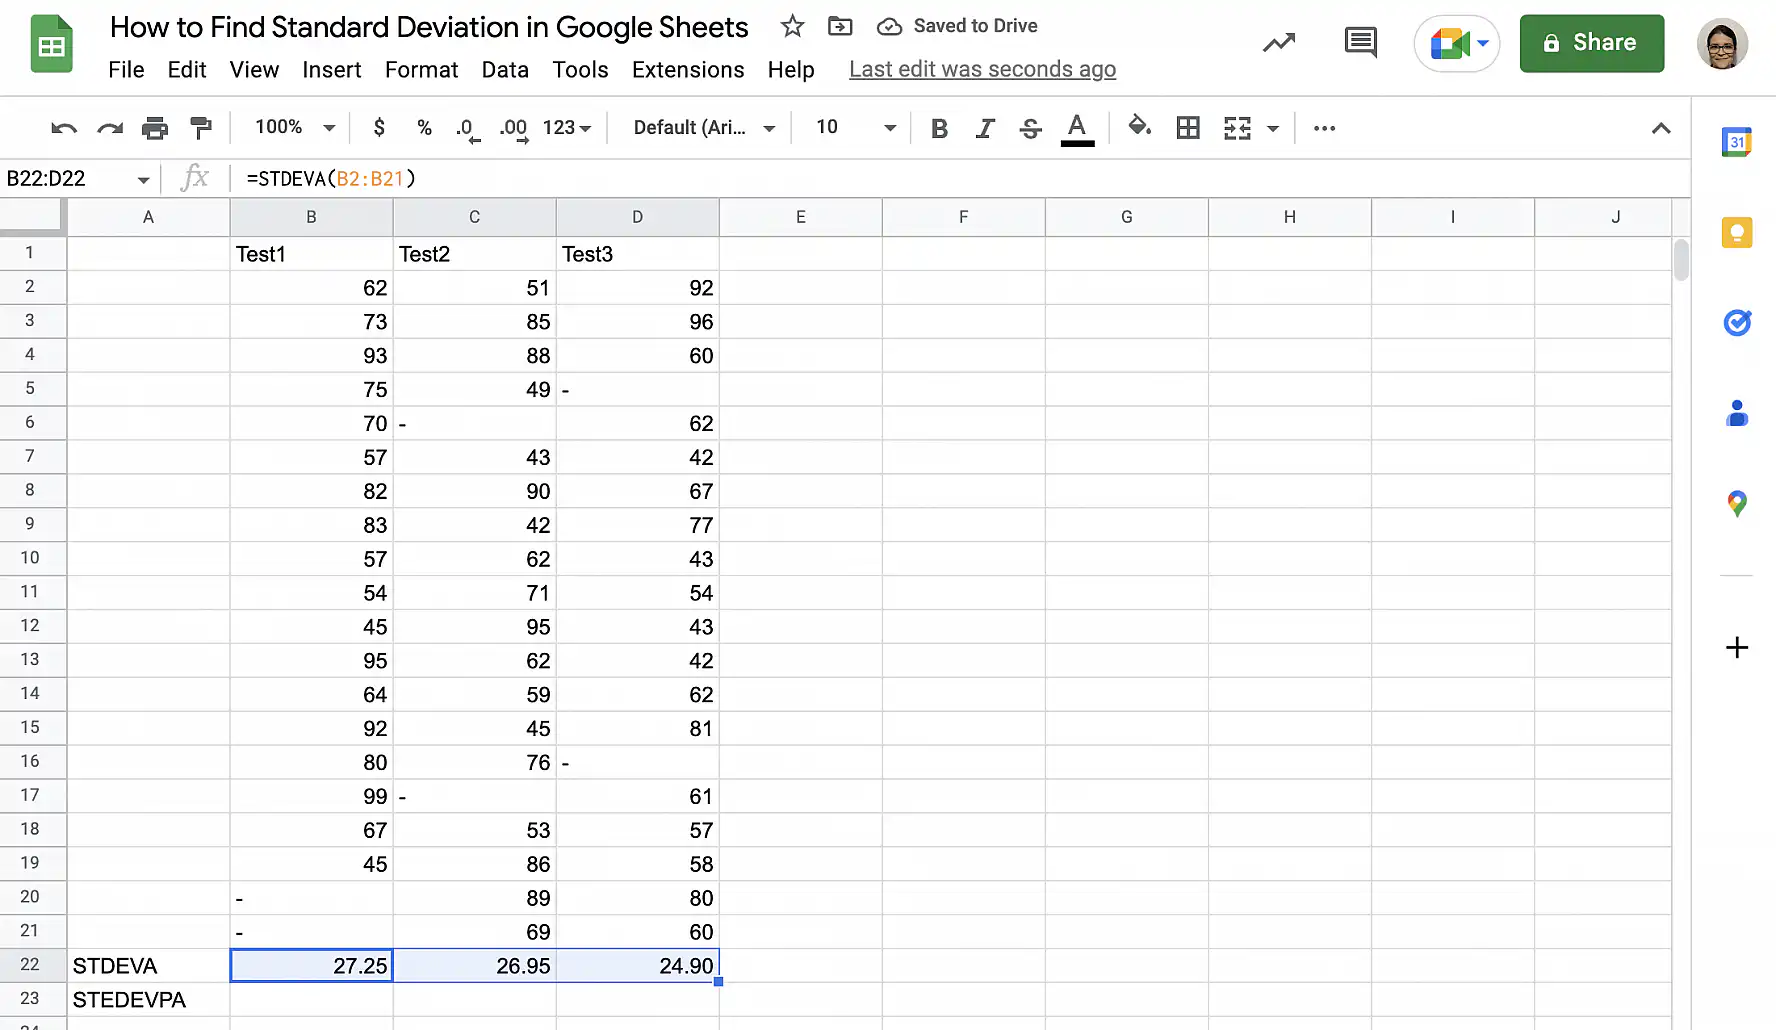
3. In the row beneath, repeat steps 1 and 2 with the STDEVPA function to see the difference. For Test1, STDEVPA returns 26.56, a little lower than the 27.25 that STDEVA gives.
DSTDEV vs. DSTDEVP
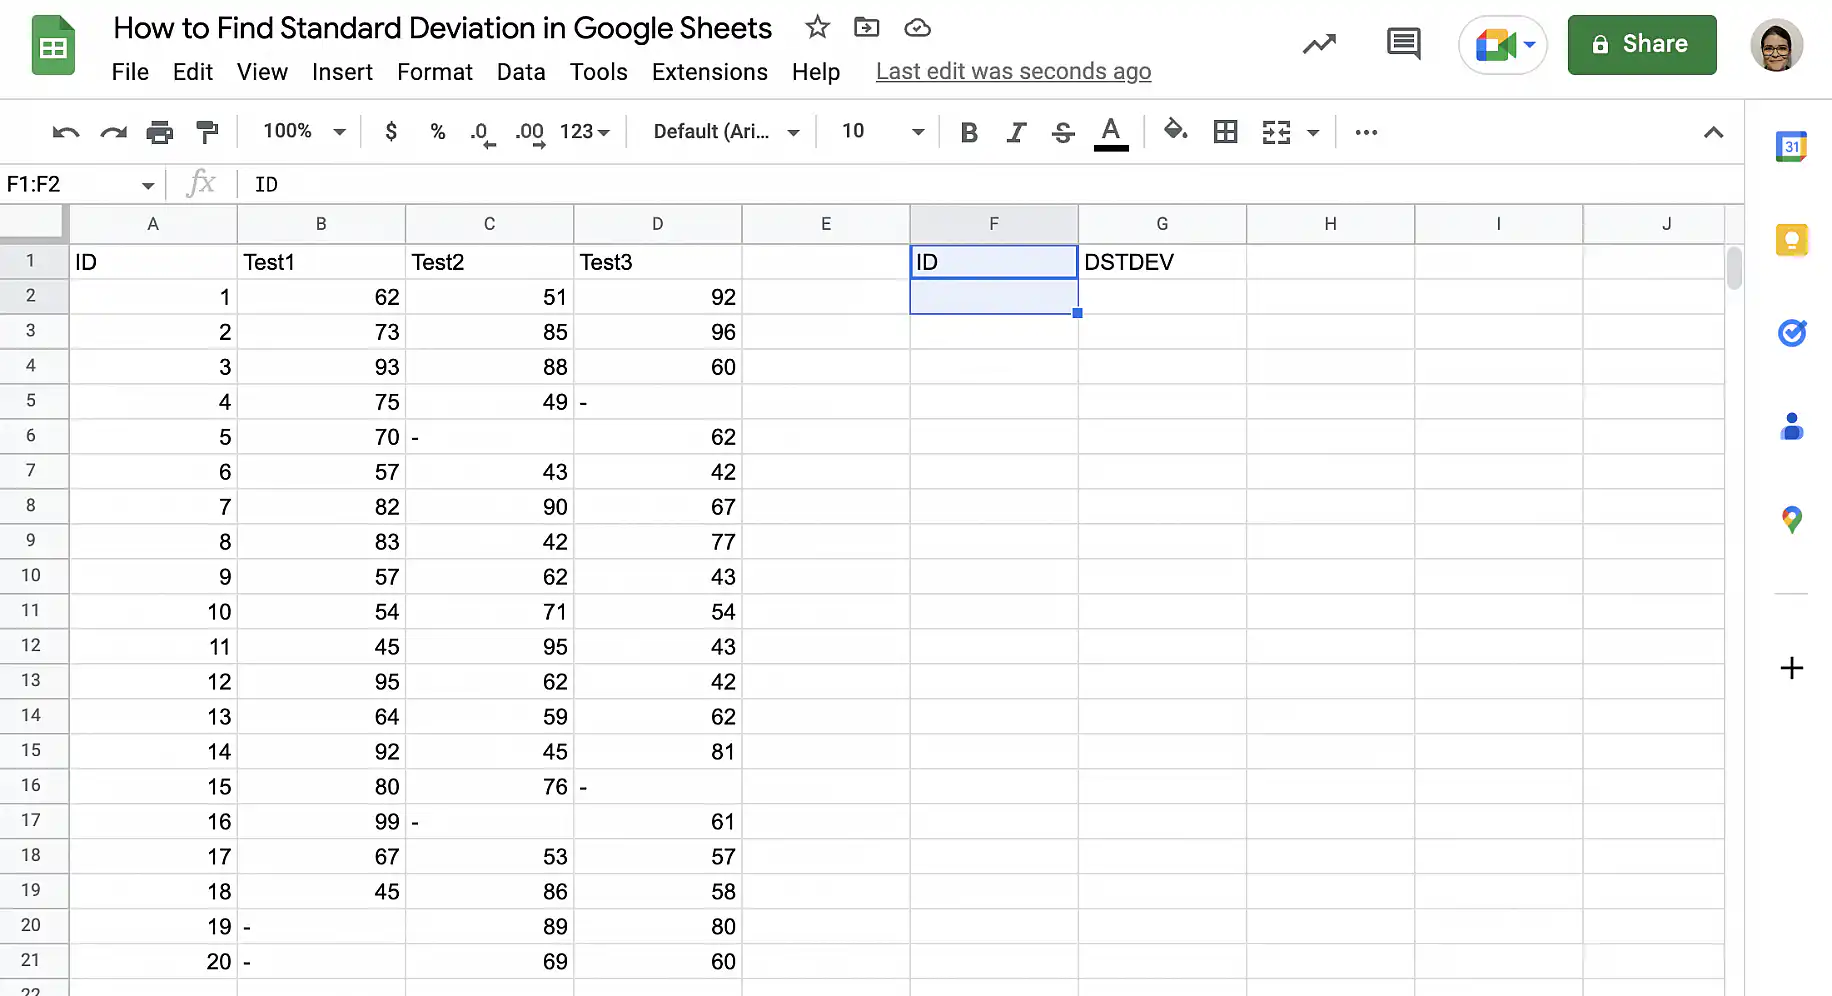
For this last example, I will use the database functions DSTDEV and DSTDEVP. To use these functions, you need to structure your data in tabular form. The first row should contain the headers of field labels, and subsequent rows should contain individual records. With these functions, cells containing text characters will be ignored, not replaced by zeroes.
1. Set up the criteria array for the function as shown below. In this case, I want to include all IDs, so I will leave the second row empty in the criteria array.
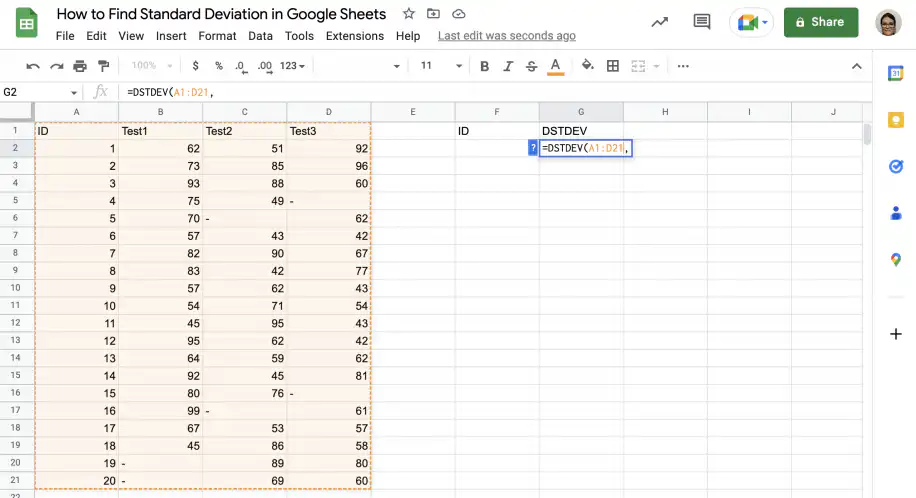
2. In an empty cell, type the DSTDEV function and select the table, including the headers.
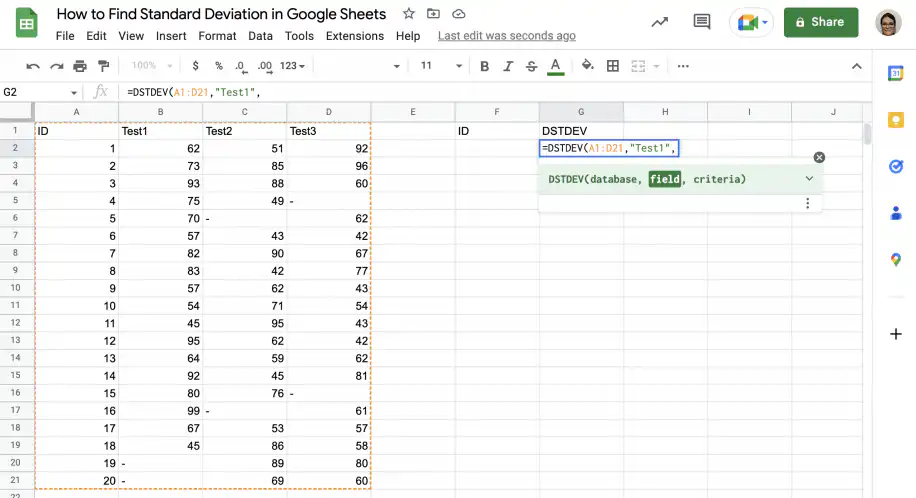
3. Add a comma followed by the header or field label for the column you want. In this case, the ‘Test1’ column.
4. Finally, select the cells containing the criteria array and close the parenthesis.
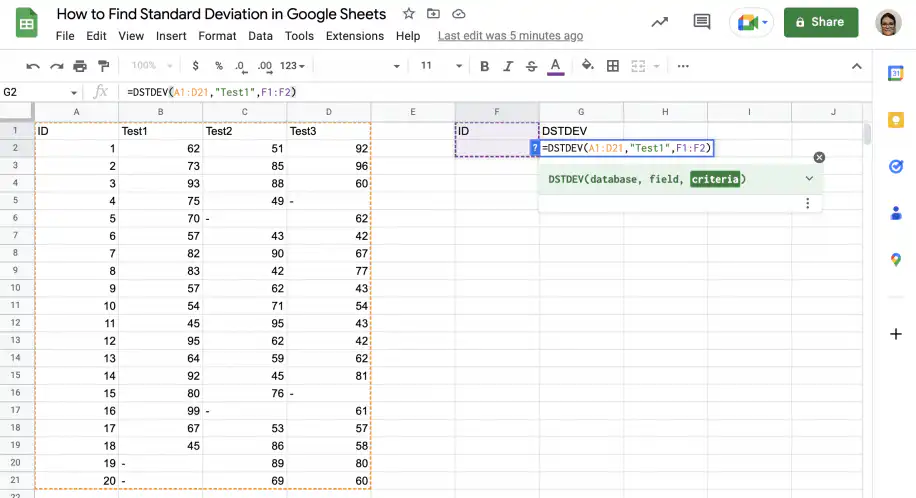
5. Press Enter to see the result: 16.84 for Test1. Repeat steps 2 to 5 with the DSTDEVP function to get the population value, which is 16.36.
Conclusion
Calculating standard deviation in Google Sheets is very easy. Higher standard deviation values indicate that the data is spread out, while a lower standard deviation indicates that the values are centered around the mean or average of the dataset. Remember that the value obtained for the standard deviation will vary depending on whether you use the sample or population formula. The standard deviation for a sample will be higher, as it is calculated over n-1, not N.
You now know the formulas used to find the standard deviation for a sample and a population, but you also know that Google Sheets provides multiple versions of the formulas as built-in functions. You have step-by-step instructions on how to find the sample and population standard deviations using STDEV and STDEVP. If some of the cells in your dataset contain text characters that represent zeroes, you can use STDEVA and STDEVPA to convert text values to zeroes. Finally, if your data is structured in a database-like table, you know how to use DSTDEV and DSTDEVP to find the standard deviation for a sample and a population.
To check whether two sets of values move together, rather than how spread out one set is, use the CORREL function in Google Sheets. And if your data is spread across several spreadsheets, Sheetgo, an AI-powered data automation platform, can bring it into one sheet on a schedule, so your standard deviation updates as new numbers arrive.

 English
 Español
 Português do Brasil
 Français