




You can analyze financial statements using multiple methods, including horizontal and vertical analysis. Horizontal analysis studies changes to variables over time, using historical data to predict future trends. Vertical analysis, however, studies the proportions of the total amount represented by the different variables during a single period.
In this article, you will learn about the vertical analysis of financial statements and how to incorporate it into your company’s accounting practices. You will also learn how to carry out vertical analysis using both an income statement and a balance sheet.
What is a vertical analysis?
While horizontal analysis is concerned with variable change over time, vertical analysis focuses on the proportion each item represents for the whole amount in a single period. Hence why it’s called vertical analysis – you add your calculations vertically next to each item. Since these proportions are expressed as percentages, you can easily compare them to other time periods or other companies.
Vertical analysis is not concerned with changes over time, but you can use the results for that purpose. By doing a horizontal analysis of these results, you can study changes to each item’s contribution to the total over multiple periods. This could help identify significant patterns or trends. To learn more, check out our articles on horizontal analysis and trend analysis.
Vertical analysis formula
The vertical analysis of financial statements is concerned with the proportion of the total amount that each line item represents. This is calculated by dividing the value for each line item by the total and multiplying by 100.
% of total = (line item value / total value) * 100
For example, on an income statement, the value of each revenue stream is a separate line item, which contributes to the total revenue.
% of total revenue = (sales revenue / total revenue) * 100
Doing a vertical analysis for multiple periods allows you to use the results for a detailed horizontal analysis, so you can look for potential patterns or trends in the way different line items contribute to the total.
How to perform vertical analysis?
The vertical analysis of financial statements is a straightforward process regarding the calculations required. This allows you to set up a simple template in a spreadsheet quickly, so you can focus on the other steps. In the next section, I will apply these steps to two different examples: the first with an income statement and the second with a balance sheet.
1. Select the time period
First, decide which period you want to analyze. You can analyze multiple periods separately, then do a horizontal analysis to look for trends. If you already use templates for your financial statements, it’s easy to include the formulas for vertical analysis by adding columns or a new section.
2. Gather data
Once you know what time period to focus on, you need to choose the documents and values you want to analyze. For example, you could choose to study the contribution of each revenue stream to the total amount of revenue using the information from the income statement.
In addition to the data for your company, collect the same data for similar companies in your industry. You can calculate the proportion of each line item from the total based on publicly available financial data.
3. Calculate line items as % of total
Since you have all the data you need, it’s time to calculate the % of the corresponding total for each line item, both for your data and that of your competitors. For each line item, use the following formula:
Percentage of total = (line item value / total value) * 100
4. Analyze & compare results
Now, it’s time for the most important step – analyzing and interpreting the results for the period. The interpretation of these results is likely to be more accurate if you can compare them to previous results, as well as those of your competitors.
Vertical analysis examples
Tools like Google Sheets or Excel allow you to automate calculations, so you can focus on analysis. With Sheetgo’s AI automations, you can also connect the spreadsheets that hold your financial statements, so the data updates on its own and your reports use the latest numbers.
The following examples demonstrate how to do a vertical analysis using these free balance sheet template and income statement template. The calculations are performed in Google Sheets, but you can easily do the same in Excel.
Vertical analysis for income statements
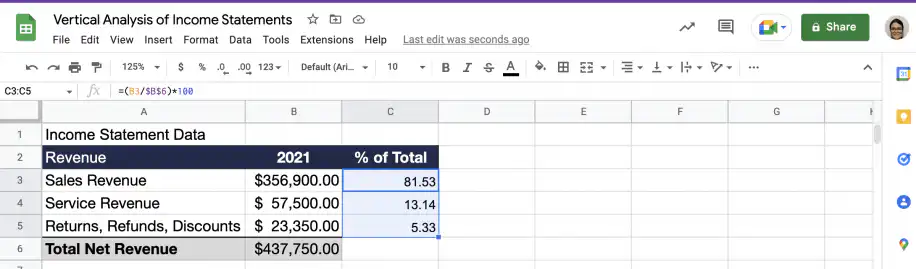
In this first example, I will do a vertical analysis of Company A’s revenue based on its annual income statement.
1. Select the time period
For this example, I will carry out the analysis of the data reported for 2021. However, you can do this very quickly for multiple years, particularly if you’re using an income statement template.
2. Gather data
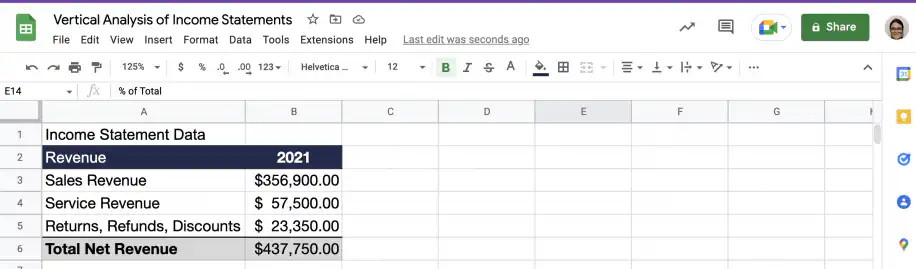
I can find the data I want to analyze for 2021 at the top of the income statement: ‘Revenue’.
3. Calculate line items as a percentage of total
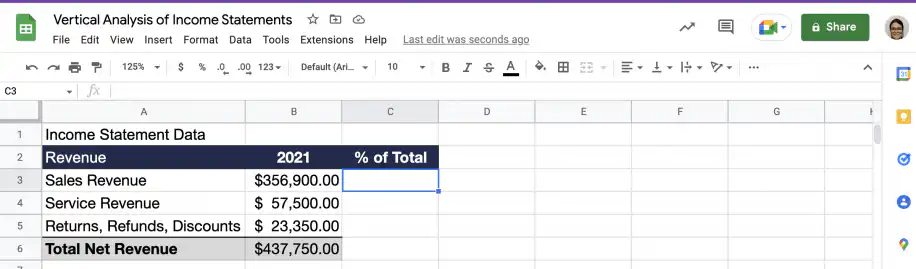
Insert a column to the right of ‘2021’ and click on the cell corresponding to the first line item.
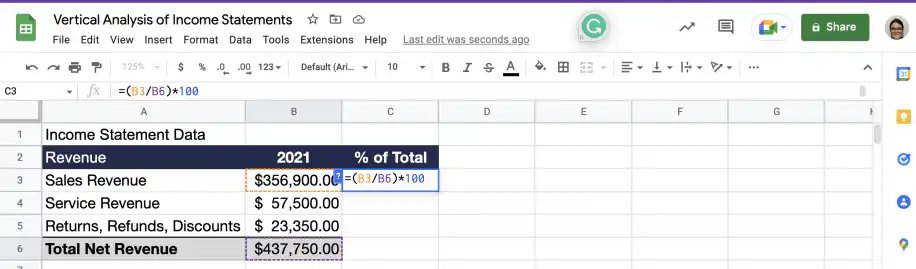
Type in the equal sign, open parenthesis, and select the value for the first line item to add the cell reference. Add a “/” to divide, and click on the value for the total to add the cell reference. Close the parenthesis and multiply by 100.
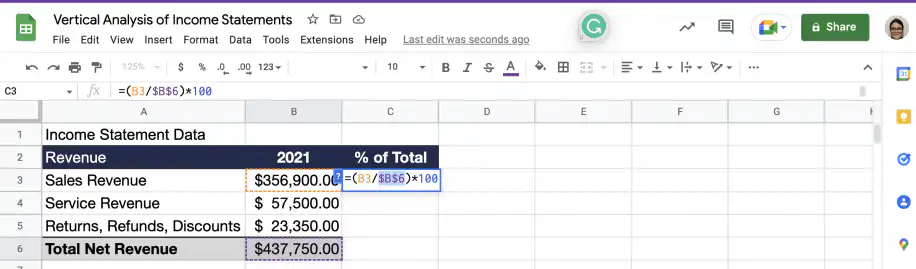
Since the total will be the same for all line items in this section, use absolute referencing ($) for the total. Drag down the cell with the formula to copy it to the other revenue line items.
4. Analyze & compare results
Now that I have performed the required calculations on Company A’s data, I need to do the same for companies in the same industry that are similar to Company A. This will allow me to analyze and compare results in context, increasing the likelihood of an accurate interpretation.
Vertical analysis for balance sheets
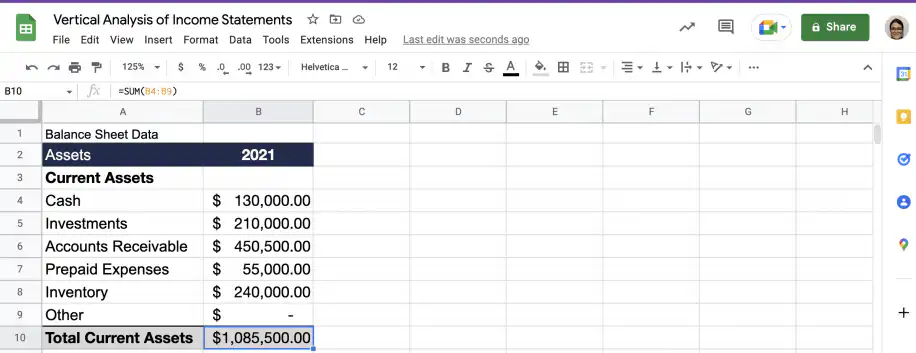
In this second example, I will be doing a vertical analysis of Company B’s current assets based on its annual balance sheet.
1. Select time period
For this example, the analysis will be carried out on the data reported for 2021. However, you can do this quickly for multiple years, particularly if you use a balance sheet template.
2. Gather data
I can find the data I want to analyze for 2021 at the top of the balance sheet: ‘Current Assets’.
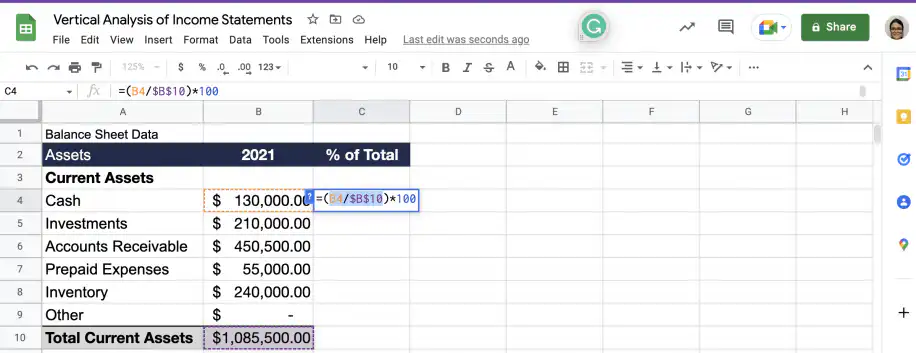
3. Calculate line items as % of total
Insert a column to the right of ‘2021’ and click on the cell corresponding to the first line item.
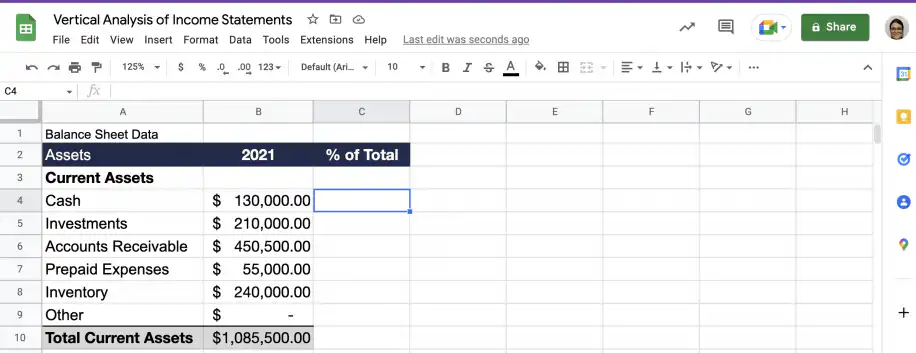
Type in the equal sign, open parenthesis, and select the value for the first line item to add the cell reference. Add a “/” to divide, and click on the value for the total to add the cell reference. Close the parenthesis and multiply by 100.
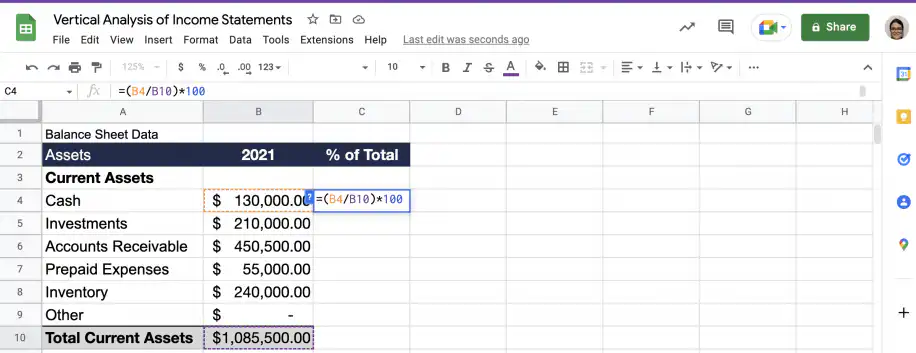
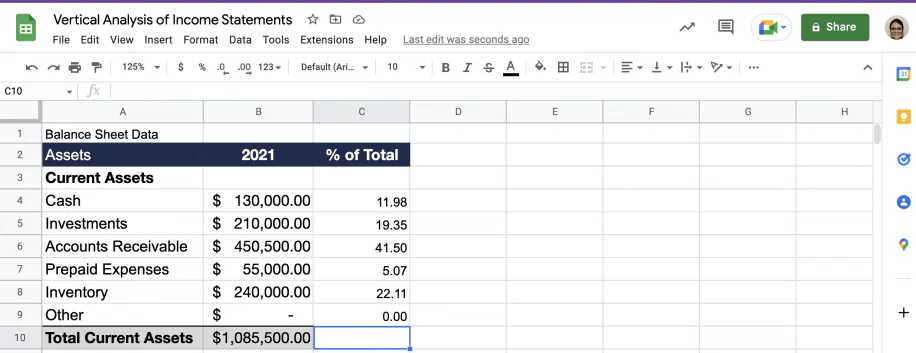
Since the total will be the same for all line items in this section, use absolute referencing ($) for the total. Drag down the cell with the formula to copy it to the other current asset line items.
4. Analyze & compare results
Now that I have performed the required calculations on Company B’s data, I need to do the same for companies in the same industry that are similar to Company B. This will allow me to analyze and compare results in context, increasing the likelihood of an accurate interpretation.
Conclusion
The vertical analysis of financial statements can be done more comfortably using spreadsheet software like Excel or Google Sheets. To keep those calculations current, Sheetgo’s AI finance virtual employee can pull the latest figures from your statements into one file and share the results with your team.
You now know about the vertical analysis of financial statements and how it differs from the horizontal analysis. You know how to do a vertical analysis with Excel and Google Sheets, using both an income statement and a balance sheet.
To learn more about different types of financial analysis, check out these articles:


 English
 Español
 Português do Brasil
 Français