




Google Sheets is the go-to solution to perform financial calculations. Apart from the fact that it’s free, this cloud-based spreadsheet app makes it easy to store, calculate, and analyze any type of data.
Whether you’re looking to manage your personal finances or business operations, Google Sheets includes a wide range of financial functions that help you calculate key information such as compound interest or the compound annual growth rate, aka CAGR. This is the best formula to evaluate how different investments have performed over a period of time.
In this article, you’ll learn what CAGR is, how to write the formula syntax, how to calculate CAGR, as well as how to use two alternative formulas, POW and RRI, to calculate CAGR in Google Sheets.
What is the CAGR formula?
CAGR stands for compound annual growth rate and is a concept used to assess the performance of various investments over a specific period. For example, as an investor, the CAGR formula can help you compare stocks within a peer group or against a market index.
CAGR standard formula syntax
CAGR is not a built-in formula in Google Sheets but as you’ll see, the syntax is not complex at all:
CAGR = (EV / BV) ^ (1/n) – 1
- EV – Refers to the ending value
- BV – Refers to the beginning value
- n – Represents the number of years
To fully understand the formula, these are the steps taken to calculate CAGR:
1. EV / BV is the value of an investment at the end of the period divided by the value at the beginning of the period.
2. The result obtained from EV / BV is raised to an exponent of one divided by n, the number of years.
3. Subtract 1 from the result obtained from (EV / BV) ^ (1/n).
4. To obtain a percentage, multiply the result by 100
How to calculate CAGR in Google Sheets?
Now that you know what CAGR is and what it’s used for, you’ll learn three ways to calculate it in your Google Sheets. Alternatively, you can also use an online CAGR calculator. This is how you can calculate CAGR manually in your Google Sheets.
How to calculate CAGR manually?
To calculate CAGR, you need to make sure that your spreadsheet contains the following values: ending value, beginning value, and the number of periods/years.
1. Open the Google Sheets where you’d like to calculate the CAGR. Check that you have the required values.
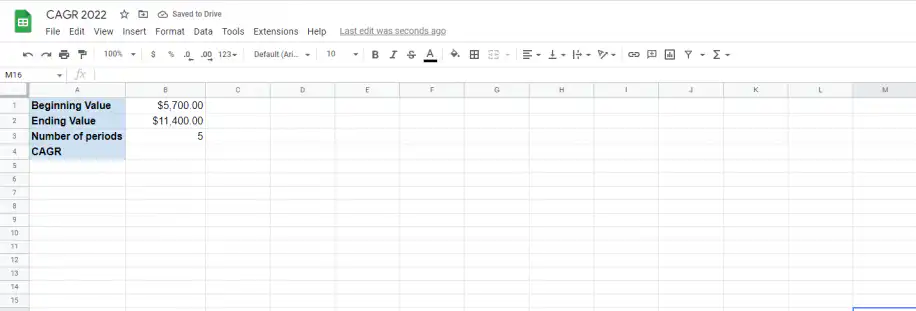
2. Type in an equal sign, followed by an opening parenthesis, to trigger the formula function in Google Sheets. Then, select the cell containing the ending value, add the division sign “/”, select the beginning value, and close the parenthesis.
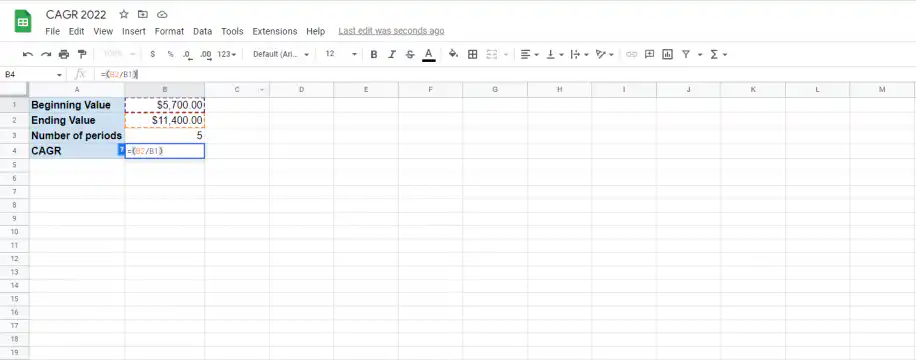
3. Add the exponent sign “^” followed by “1″, the division sign “/”, and select the cell corresponding to the number of periods. Once again, this should be placed between parentheses.
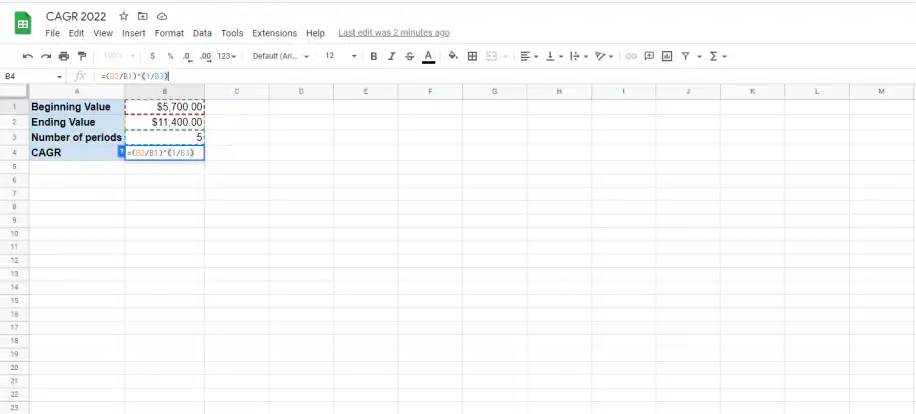
4. Add a minus sign and “1″ to subtract one from the result.
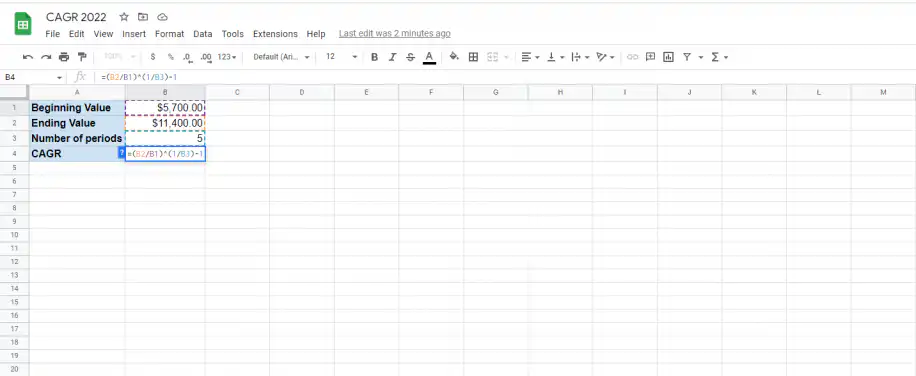
5. To format the result as a percentage, add the multiplication sign “*” and then “100″. To obtain the result, press “Enter”.
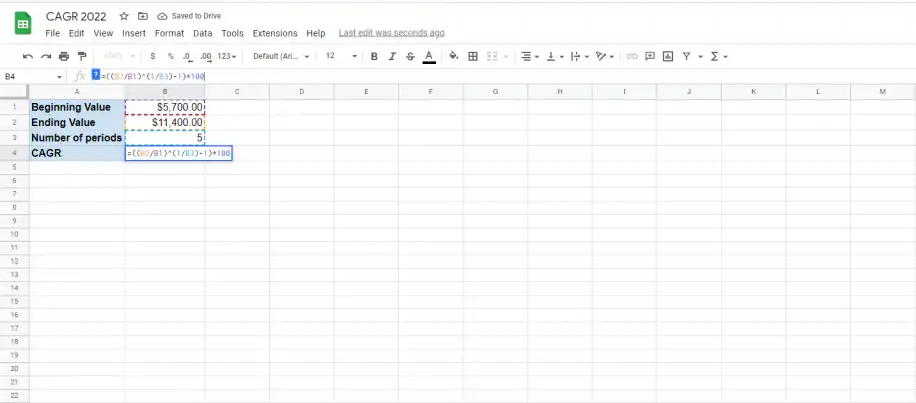
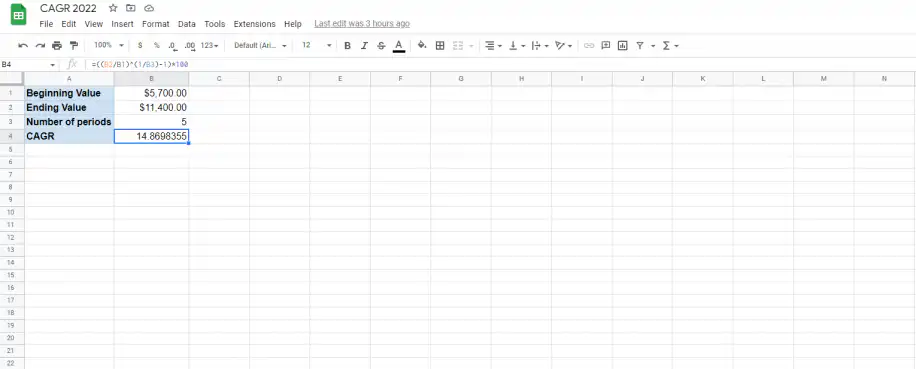
6. You should now see the result of the CAGR as a percentage.
How to calculate CAGR with the POW function?
You can calculate the CAGR in Google Sheets using the POW function. Unlike CAGR, the POW function is built into Google Sheets. Here’s the syntax for the POW function.
POW function syntax
=POW (base, exponent)
- base – refers to the number raised to the power of
- exponent – the number the base is raised to
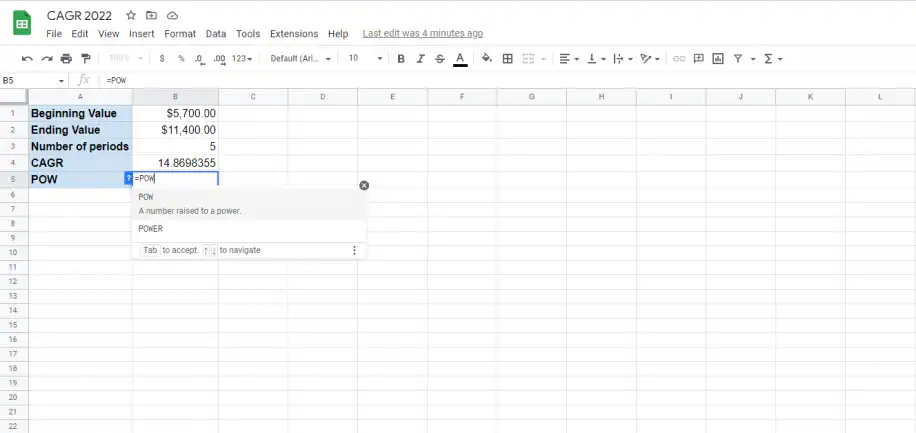
1. Type in an equal sign and “POW” to trigger the POW formula in Google Sheets.
2. Open parenthesis and add the ending value, the division sign, and the beginning value. Then, separate this division by a comma “,” and add the second part of the CAGR formula, “1″, the division sign, select the number of periods value, and close parenthesis before subtracting by one, “-1″.
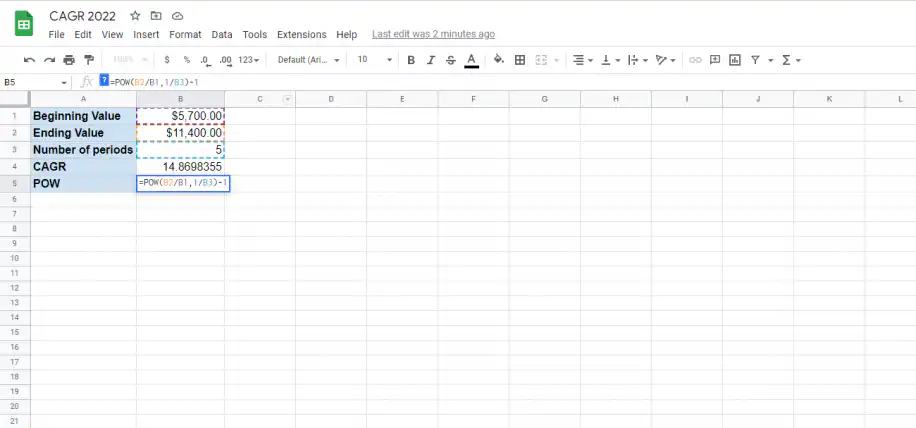
3. To obtain the same result as before, as a percentage, add extra parentheses and include “*100″ at the very end of the formula, as shown below.
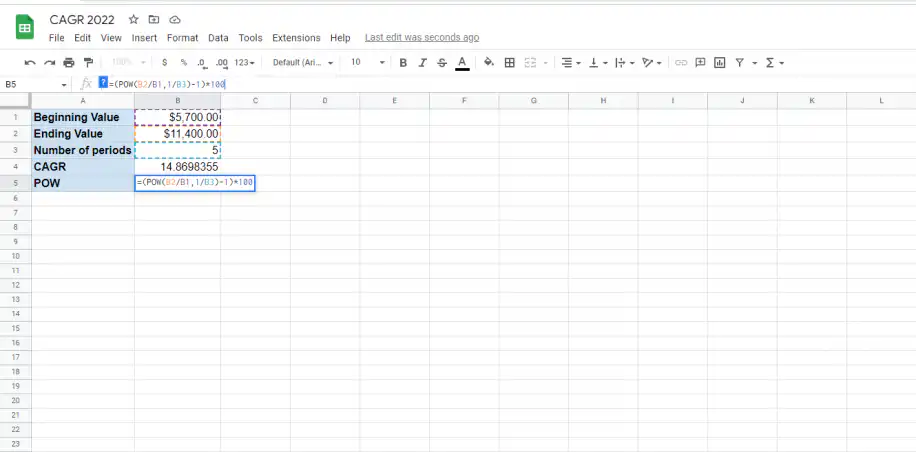
4. Press “Enter” to obtain the same result using the POW function.
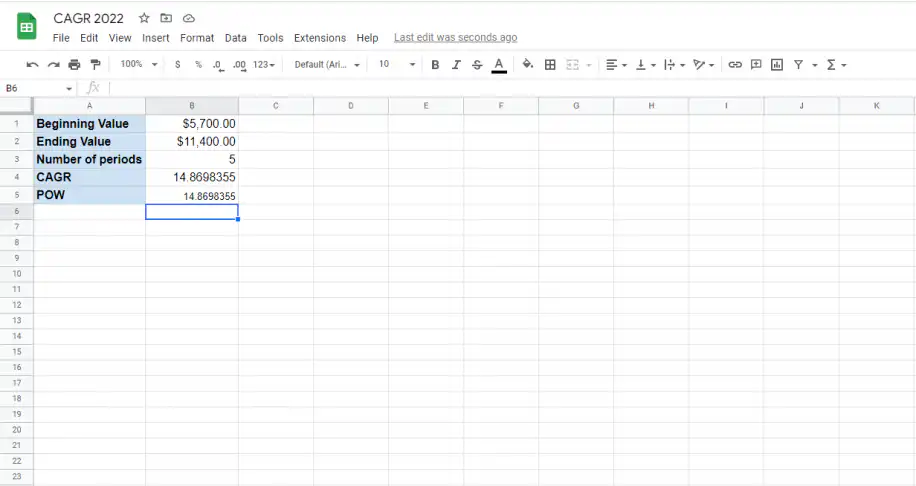
How to calculate CAGR with the RRI function
The RRI function can also be used in Google Sheets to calculate the CAGR. The RRI formula in Google Sheets calculates the interest rate you need for an investment to reach a value within a specified number of periods. Let’s see what the RRI formula looks like.
RRI formula syntax
The syntax of the RRI function is:
=RRI(number_of_periods, present_value, future_value)
- number_of_periods – the number of periods.
- present_value – the current value of the investment.
- future_value – the future value of an investment.
1. Type in an equal sign and “RRI” to trigger the RRI formula in Google Sheets.
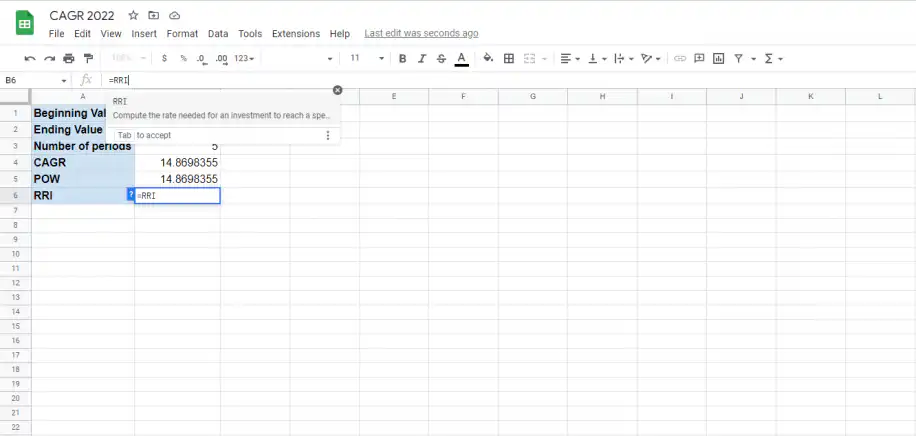
2. Open parenthesis, and select the cell containing the number of periods to include it in the RRI formula. Follow with a comma.
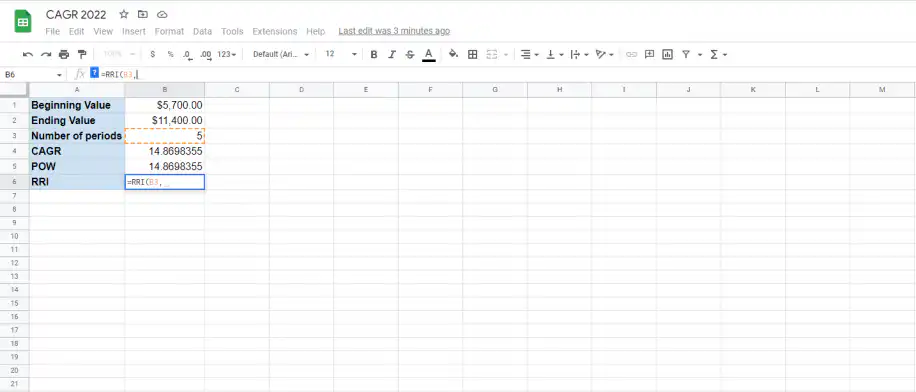
3. Select the cell corresponding to the beginning value to include in the formula.
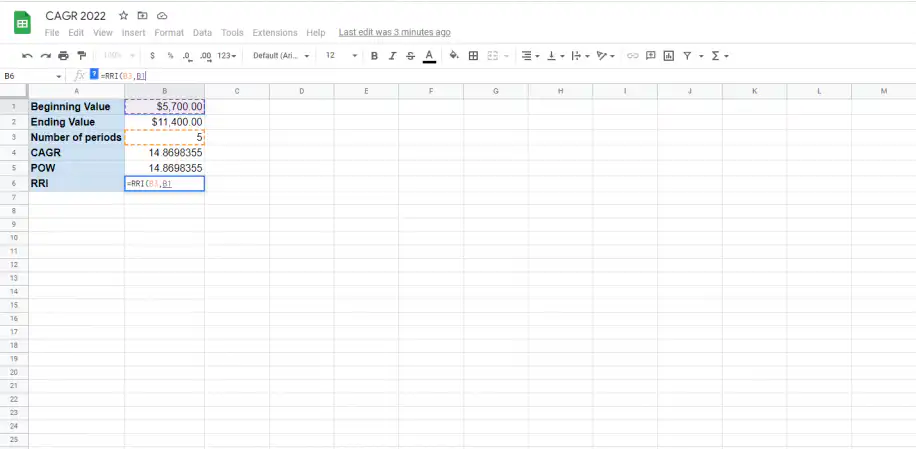
4. Add a comma and then select the cell corresponding to the ending value. Close parenthesis.
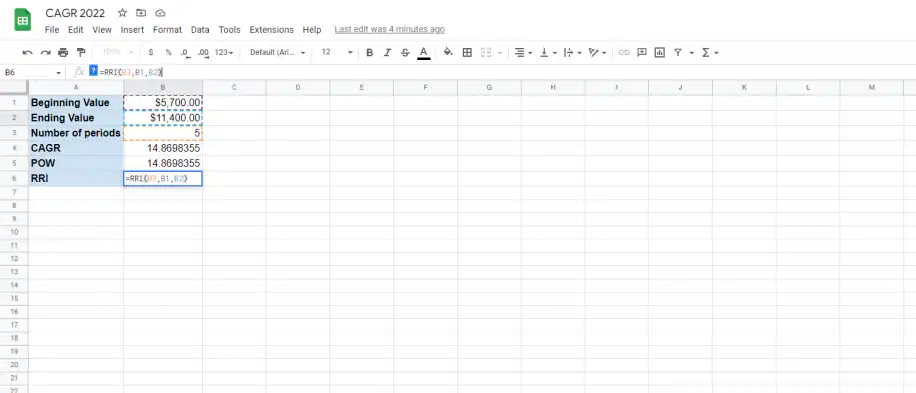
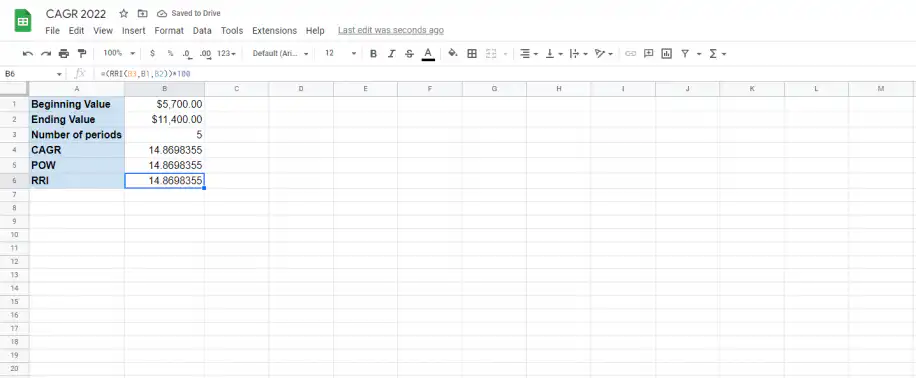
5. To format as a percentage, multiply by 100 by adding “*100″ as shown below.
Conclusion
As you can see, Google Sheets has become a truly versatile spreadsheet app for many business people since it allows users to perform basic to advanced financial calculations. Not only this, but it also offers a wide variety of formulas to import financial data, such as the GOOGLEFINANCE function or the YahooF function via Google Apps Script.
You should know now what the CAGR is, how it’s expressed, and the two alternative ways to calculate it in Google Sheets using the POW function and RRI function. Learning how to calculate the CAGR manually is important so you can fully understand the data needed. However, the RRI function is the most suitable if you prefer a quicker method.
If you want to learn about more financial formulas in Google Sheets and Excel, check out any of the articles below:
- Google Sheets FORECAST function (+ examples)
- Excel GROWTH function: How to use and examples
- RATE formula in Google Sheets
- FV formula in Google Sheets
- How to calculate year-over-year growth
To keep the beginning and ending values behind your CAGR up to date, Sheetgo’s AI finance virtual employee can pull them from your spreadsheets into one file.

 English
 Español
 Português do Brasil
 Français