


Creating Power BI reports
Power BI is Microsoft’s cloud-based data analytics and reporting service. It offers a collection of tools that help you draw insights from large datasets — and create visualizations to share that data with others. Power BI is easy to use, enabling anyone to quickly generate reports and dashboards from data stored in spreadsheets or database software.
Report or dashboard?
A dashboard is a single page (or canvas) used to present the most important metrics from various reports or datasets. They’re ideal for monitoring dynamic data and key trends in real-time.
In contrast, a report is more detailed, often containing multiple pages, and usually based on a single dataset.
Power BI reports are interactive. People viewing the report (referred to as “report consumers” by Microsoft) can filter, highlight, and slice the information and take a closer look at the data by inspecting specific tables, fields, and values.
Once you’ve created a report in Power BI, you can pin your data visualizations to a dashboard.
Bring your data to life with Power BI
There has recently been a huge growth in demand for data visualization and reporting, as organizations have realized that it’s essential for business intelligence and data-driven decision making.
Transforming the way data looks (and making sure it’s accessible and understandable) is one of the biggest challenges for businesses today.
Here I’ll show you how to start transforming your raw data into engaging reports, without any data analysis or design skills.
Step 1: Select your data
If you’re not already using it, sign up for Power BI from Microsoft.
In the following example, I’m using a Power BI sales and marketing file (PBIX) from Microsoft’s homepage.
From inside the Power BI home screen, click Get Data.
Choose from the list or click More.
You can use various data sources for Power BI reports including Excel and CSV files, online services like Facebook and Adobe, or a database such as Oracle.

Step 2: Create a chart in Power BI
Two menus appear: Visualizations and Fields. A visualization (also known simply as a visual) is the chart, graph, or diagram that presents insights from your dataset. Fields are the tables and folders containing the data you want to present.
For my first visualization, I will create a simple Time Series Chart by clicking on Sales Fact and selecting Sum of Revenues from the dropdown menu.
You can move this, or any other KPI, by dragging and dropping it to Values under the visualizations side menu.
In addition, you must add the dates under Axis.
Go to Date and then, via the dropdown menu, move the date field to Axis.
You can now resize and move the chart.

Under the Visualizations submenu, you can choose from different diagram styles.
Note that, when the original file is updated, the data will be automatically updated in Power BI — there’s no need to connect the data source again.
Step 3: Add a map to your Power BI report
Click on an area of blank space on the report page so that none of your graphs are selected.
Under Visualizations, click on Map. Under Geo, select State and drag and drop it to Location.
From SalesFact, select a KPI. Here I’ve added Sales $. Drag and drop it to Tooltips.
Go to Format and then go to Heat map and slide it to On.

Step 4: Add data in cards and tables
One of the strengths of Power BI is that complex data can be boiled down to simple visualizations. Cards and advanced tables are great tools to help you do this.
Here I’ve created a multi-row card that shows sales, the number of products sold, and the total revenue for each product category.
Under SalesFact, search for Sales $, Sum of Revenue and Total Units. Tick all of them or drag and drop them to Fields.
In the Product sub-menu, search for Category and move it to Fields.

Step 5: Change the formatting of your visualization
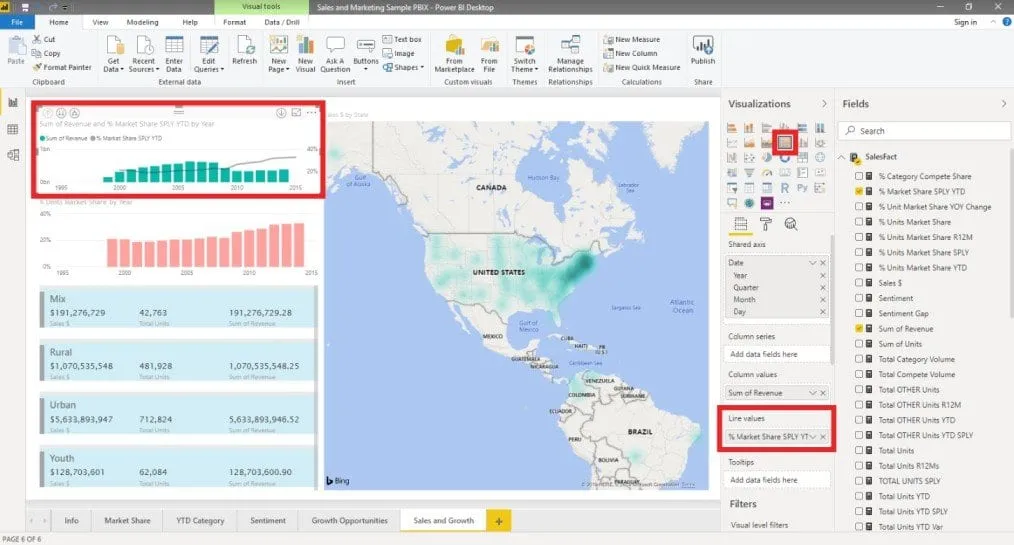
Go to the Format pane and change the colors and format. For the multi-row card, I’ve added a simple background to highlight each product category.
Under Format, you can customize the design to match your company branding by changing the color, font, and spacing.
If you want a bar chart instead of a simple line chart, just click on your preferred graph/diagram style.
In the example here, I’ve chosen a line and stacked column chart and added another field under Line values.
Step 6: Export your report
If you want to share PBIX files with colleagues or clients, they will also need a Power BI account.
Alternatively, go to File >Export to. Here you can publish your Power BI report as a PDF or other format.
Want to create reports with other software?
Got data in Excel files but want to use a different visualization and reporting tool such as Google Data Studio?
Check out our post on how to connect Excel to Google Data Studio to learn how to pull your Excel data directly into Data Studio.



 English
 Español
 Português do Brasil
 Français