




In descriptive statistics, there are some measures that can help you assess the spread of the values in your dataset. While the range measures the distance between the lowest and highest values, the interquartile range (IQR) indicates where most of the values lie in your dataset.
In this guide, you will learn what the interquartile range (IQR) means, what it says about the spread of the majority of your values, and how to find it for odd and even sets of numbers. You will learn how to find the interquartile range manually and using Google Sheets.
What is the interquartile range (IQR)?
The interquartile range (IQR) refers to the middle 50% of the values in your dataset. Once a dataset has been ordered and divided into four equal quarters, the interquartile range focuses on the middle quartiles – second and third – while ignoring the top and bottom quartiles.
How to find the interquartile range?
To find the interquartile range of your dataset, you must first find the median for both the lower and upper half of your data. These correspond to the first (Q1) and third (Q3) quartiles. The interquartile range is found using the following formula:
IQR = Q3 – Q1
However, keep in mind that there are different methods available depending on whether you include the median value when finding Q1 and Q3: inclusive and exclusive.
- For an even set of numbers, the method is always exclusive.
- If you have an odd set of numbers, it’s up to you whether you include the median or not.
For the sake of clarity, all the odd-numbered examples below use the inclusive method, as this is also the method used to calculate quartiles in Google Sheets.
How to calculate the interquartile range manually?
Below, you have step-by-step instructions on how to find the interquartile range manually. First, for an odd set of numbers, then an even one.
The interquartile range for an odd set of numbers
Follow the instructions below to find the interquartile range of an odd set of numbers: 1,10,3,13,5,8,14.
1. Order your values in ascending order.
Ordered set: 1,3,5,8,10,13,14
2. The median or middle value in your set should have the same number of values above and below it. For this set, the median is 8.
1,3,5,(8),10,13,14
3. Now that you have the two halves of your dataset, you need to find Q1 and Q3. When using the inclusive method, you must include the median in both halves.
Lower half: 1,3,5,8
Q1 = (3+5)/2 = 4
Upper half: 8,10,13,14
Q3 = (10+13)/2 = 11.5
4. To get the interquartile range, subtract the value for Q1 from Q3. The IQR for this set is 7.5.
IQR = Q3 – Q1 = 11.5 – 4 = 7.5
The interquartile range for an even set of numbers
In the previous example, finding the median is very straightforward since there is an odd number of values in the set. However, what happens when it’s an even set? Follow the steps below to find the interquartile range of an even set of numbers: 1,16,3,13,8,10,14,5
1. As before, order your values in ascending order.
Ordered set: 1,3,5,8,10,13,14,16
2. Since the set has an even number of values, there are two middle values instead of one. To find the median, take the mean of these two middle values: 8 and 10.
1,3,5,8,10,13,14,16
Median = (8+10)/2 = 9
3. However, you can split the values into the lower and upper halves without calculating the median since you need the values for the median of each half. To get Q1 and Q3, find the median for the lower and upper halves.
Lower half: 1,3,5,8
Q1 = (3+5)/2 = 4
Upper half: 10,13,14,16
Q3 = (13+14)/2 = 13.5
4. Calculate the IQR by subtracting Q1 from Q3.
IQR = 13.5 – 4 = 9.5
How to find IQR in Google Sheets?
Now that you know how to find the interquartile range, let’s see how much quicker it is to do it in Google Sheets. For comparability, let’s use the same sets as in the examples worked out manually. There are two Google Sheets functions you can use to find Q1 and Q3: QUARTILE and MEDIAN.
How to find quartiles in Google Sheets with QUARTILE
This first example uses the QUARTILE function, which uses the inclusive method to calculate the quartiles. Quartile 1 matches the 25th percentile and quartile 3 the 75th, so the PERCENTILE formula in Google Sheets gives the same results with 0.25 and 0.75.
1. Open Google Sheets to the spreadsheet containing your ordered dataset. QUARTILE works on unsorted data too, but an ordered list makes the results easier to check. The SORT formula can put your values in order.
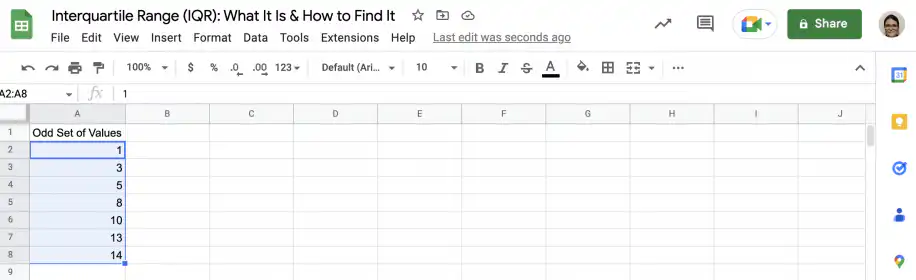
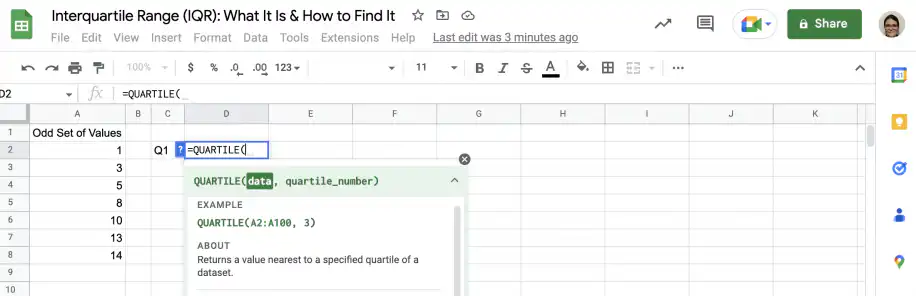
2. In an empty cell, type in the QUARTILE function.
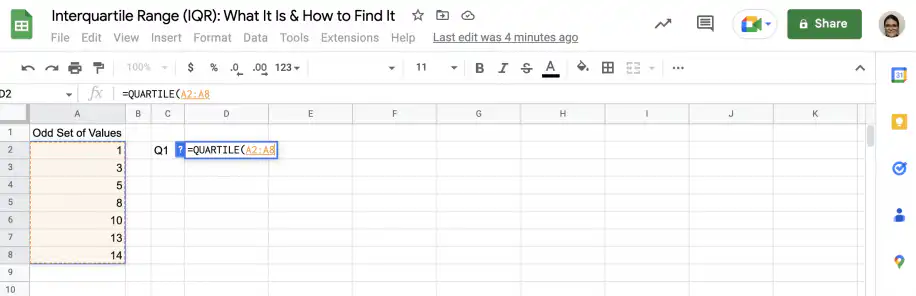
3. For the first parameter, select the cells containing the values.
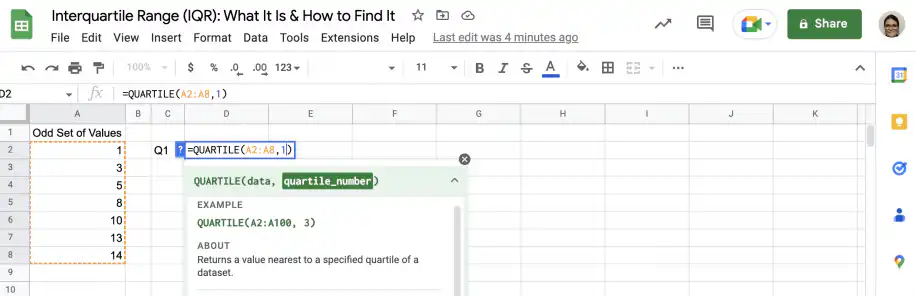
4. The second parameter specifies the number of the quartile you want to find. In this case, you want Q1, so type “1”.
5. In another empty cell, type the QUARTILE function and select the values. This time, use “3” as the second parameter to get Q3.
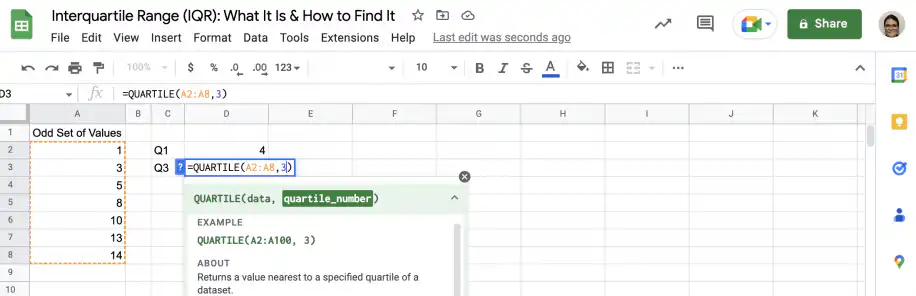
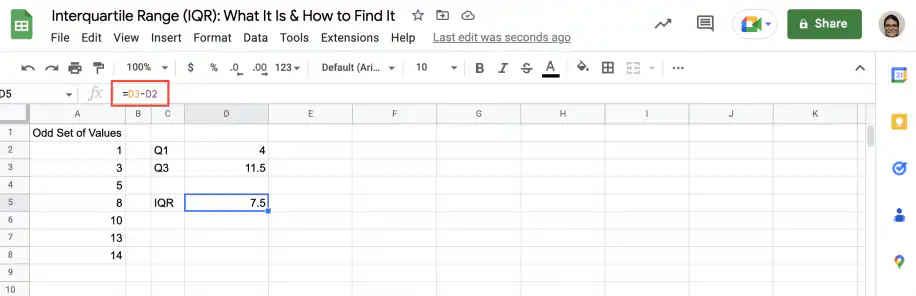
6. To get the IQR, subtract Q1 from Q3. The IQR for this set is 7.5.
How to find quartiles in Google Sheets with MEDIAN
This second example uses the MEDIAN function, which is closer to the manual method. Remember that the results will vary depending on the method used.
1. Open Google Sheets to the sheet with the even set of values.
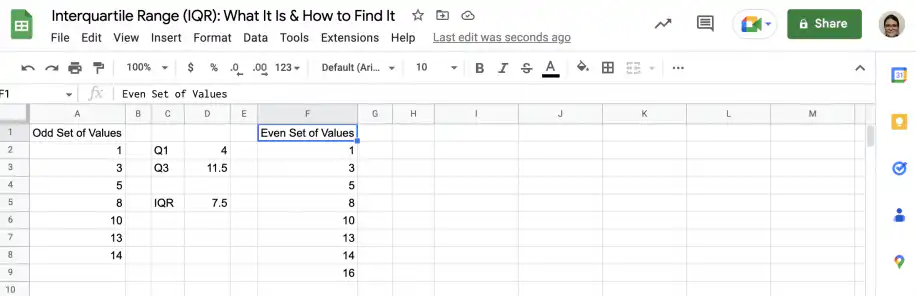
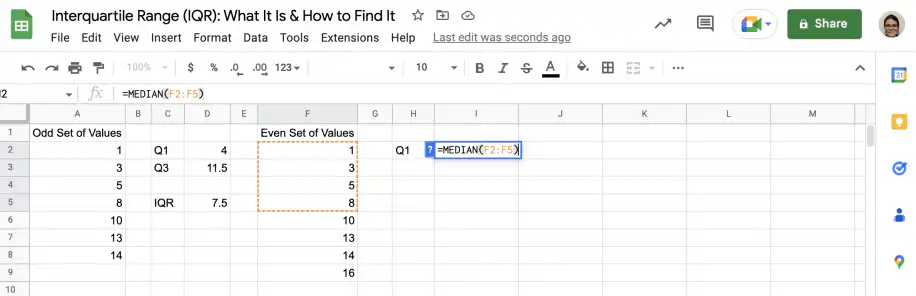
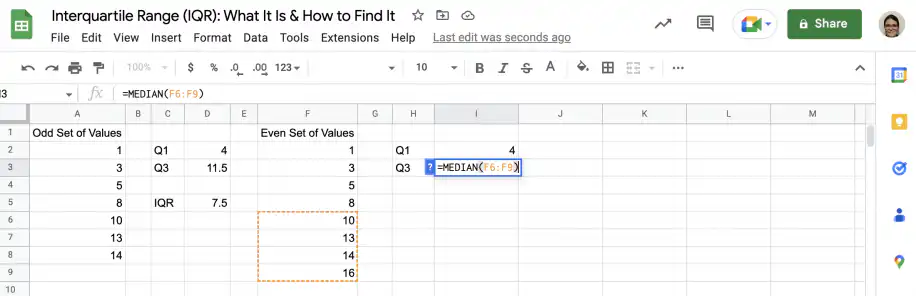
2. In an empty cell, type in the MEDIAN function and select the lower half of your values to get Q1. Press ‘Enter’ to get the result.
3. In another empty cell, type in the MEDIAN function again, but this time, select the upper half of your values to get Q3.
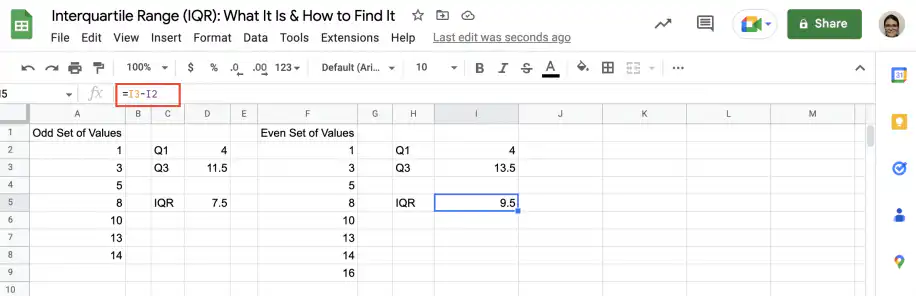
4. To get the IQR, subtract Q1 from Q3. The IQR for this set is 9.5.
Is a higher interquartile range good?
The interquartile range (IQR) measures the spread of the middle half of your dataset. For this reason, the higher the IQR value, the more spread out the values in the middle half of your dataset. This allows you to assess the variability within the bulk of your dataset. Whether you consider the values to be good or bad will depend on the circumstances and the purpose of your analysis.
Because the IQR leaves out the top and bottom quarters of your data, a few extreme values won’t change it much. To measure how far every value sits from the mean, use the STDEV formula in Google Sheets.
Conclusion
As you have seen, the interquartile range is a useful measure. Unlike the range, which illustrates the spread of your entire dataset, the interquartile range shows the spread of the middle half of your dataset. The IQR allows you to assess how much variability is present in the bulk of your dataset.
You now know what the interquartile range is and what it can tell you about the variability in the middle half of your dataset. In addition to knowing how to do this manually for even and odd sets of numbers, you also know how to find the interquartile range using two different functions in Google Sheets: QUARTILE and MEDIAN.
For the range of the whole dataset, use the MAX formula in Google Sheets to find the highest value and the MIN formula to find the lowest, then subtract one from the other.

 English
 Español
 Português do Brasil
 Français