Obtener ayuda

Centro de ayuda

Guías y respuestas

Contactar con el servicio de asistencia

Escribir a nuestro equipo

Iniciar sesión en

Workflows

Crear procesos con su equipo

Automations

Conectar archivos y automatizar tareas

Un sistema, cuatro partes

Agentes de IA

Empleados virtuales que trabajan 24/7

Automations

Conectar archivos y automatizar tareas

Workflows

Crear procesos con su equipo

Data Space

Datos compartidos y controlados con confianza

Soluciones por departamento

Finanzas

Informes, presupuestos y conciliaciones

Inventario y fabricación

Existencias, pedidos y producción en una sola vista

RRHH

Hojas de horas, asistencia y evaluaciones

Gestión de proyectos

Estado y carga de trabajo de todos los proyectos

Ventas y CRM

Leads y oportunidades al día

Educación

Expedientes de alumnos y datos escolares

Finanzas

Convierta el trabajo financiero manual en informes que se actualizan solos.

Qué automatizan los equipos de Finanzas

  • Controlar cuentas por pagar y cobrar
  • Crear estados de flujo de caja
  • Comparar presupuesto y resultados reales

Inventario y fabricación

Vea los niveles de existencias y automatice los pedidos.

Qué automatizan los equipos de inventario y fabricación

  • Controlar el inventario en varias sedes
  • Conectar datos de ventas, compras y almacén
  • Vincular un lector de códigos de barras a su hoja

RRHH

Gestione la contratación, la asistencia y el seguimiento de OKR desde sus hojas.

Qué automatizan los equipos de RRHH

  • Controlar contratación e incorporación
  • Registrar los OKR y resultados del equipo
  • Controlar entradas, salidas y ausencias

Gestión de proyectos

Asigne tareas y controle las horas sin actualizaciones manuales.

Qué automatizan los equipos de proyectos

  • Asignar tareas y seguir los cambios de estado
  • Estimar el esfuerzo y registrar las horas trabajadas
  • Seguir los hitos de todos los proyectos

Ventas y CRM

Siga los leads y el rendimiento de ventas con informes automáticos.

Qué automatizan los equipos de ventas

  • Seguir y convertir leads
  • Fijar objetivos de ventas y seguir las métricas del equipo
  • Supervisar los KPI de ventas en tableros

Educación

Automatice asistencia, calificaciones y compras escolares.

Qué automatizan los centros educativos

  • Controlar la asistencia y avisar a los padres
  • Registrar y comparar las notas de clase
  • Controlar el material prestado a alumnos y personal

Buscar un caso de uso

Por departamento

Cómo usa Sheetgo cada equipo

Por sector

Cómo usa Sheetgo cada sector

Por tamaño de empresa

Pequeña, mediana o grande

Aprende

Blog

Guías y novedades del producto

Historias de clientes

Cómo usan Sheetgo equipos como el suyo

Centro de ayuda

Guías y respuestas

Por qué Sheetgo

Comparar

Cómo se compara Sheetgo con otras herramientas

Seguridad

Cómo protegemos sus datos

Centro de confianza

Detalles de cumplimiento

Iniciar sesión en

Workflows

Crear procesos con su equipo

Automations

Conectar archivos y automatizar tareas

Un sistema, cuatro partes

Agentes de IA

Empleados virtuales que trabajan 24/7

Automations

Conectar archivos y automatizar tareas

Workflows

Crear procesos con su equipo

Data Space

Datos compartidos y controlados con confianza

Soluciones por departamento

Finanzas

Informes, presupuestos y conciliaciones

Inventario y fabricación

Existencias, pedidos y producción en una sola vista

RRHH

Hojas de horas, asistencia y evaluaciones

Gestión de proyectos

Estado y carga de trabajo de todos los proyectos

Ventas y CRM

Leads y oportunidades al día

Educación

Expedientes de alumnos y datos escolares

Buscar un caso de uso

Por departamento

Cómo usa Sheetgo cada equipo

Por sector

Cómo usa Sheetgo cada sector

Por tamaño de empresa

Pequeña, mediana o grande

Empezar

Plantillas

Flujos de trabajo listos para usar

Aprende

Blog

Guías y novedades del producto

Historias de clientes

Cómo usan Sheetgo equipos como el suyo

Centro de ayuda

Guías y respuestas

Por qué Sheetgo

Comparar

Cómo se compara Sheetgo con otras herramientas

Seguridad

Cómo protegemos sus datos

Centro de confianza

Detalles de cumplimiento

Centro de ayuda

Guías y respuestas

Contactar con el servicio de asistencia

Escribir a nuestro equipo

Workflows

Crear procesos con su equipo

Automations

Conectar archivos y automatizar tareas

Plantilla de presupuesto vs real en Excel

Companies require a good understanding of their financial situation. Therefore, many organizations plan and take the time to perform a budget-versus-actual analysis. Performing a financial forecast helps firms identify potential issues.

Indeed, comparing your forecasted ingoings and outgoings with your actual income and expenses provides essential insight. Accordingly, a proper forecast provides a clearer understanding of the company’s current position.

When analyzing the financial forecast with actual results, two possible variances can arise. Variances signify differences between the budgeted and actual figures. On one hand, a favorable variance points towards either higher income or lower outgoings. For instance, an unfavorable variance signifies a lower income or higher outgoings compared to the forecast.

External factors often cause unfavorable variances. To illustrate, companies sometimes switch between suppliers because of supply shortages. Consequently, these companies encounter unexpected switching costs.

However, variances can also point towards internal issues within a company. For instance, if a company’s income is lower than forecast, there could be an issue in the Sales or Marketing department. As a result, companies cannot underestimate the importance of forecasting and investigating variances.

Recopilación de datos para el análisis

An essential part of performing a forecast analysis is collecting and analyzing data. Simply gathering the necessary data from different departments is often challenging. Additionally, analyzing the data is a time-consuming process.

Therefore, companies benefit when their departments use efficient and accessible formats to record their data. In fact, different software solutions are available to help firms plan and analyze their financial data. However, most of these solutions come with hefty price tags.

Typically, SMEs and start-ups lack the budget and time necessary to implement specialized software. Furthermore, data is likely managed in spreadsheets. As such, consider a budget vs actual template in Excel.

budget analysis budget vs actual template excel

Why use Excel to track Budget vs Actual spend?

  • Flexible: Excel allows you to manage and analyze all your financial data in the way that suits you. Whenever you need to change the system you can simply adapt the spreadsheets — without accounting software or IT support.
  • Accesible: Excel can sync to the Cloud and transfer data in real-time. Administrators and managers can access and update Excel at any time, from anywhere.
  • Compatible con todo: All software packages integrate with Excel, so if your company has data stored in other programs, you can easily import that information.
  • Fácil de usar: Your colleagues probably already use spreadsheets and Excel is intuitive and user-friendly. As a result, the system is easy to maintain and onboarding your team is quick and simple.

Empiece a seguir su presupuesto vs real

Cómo empezar

Sheetgo’s budget vs. actual template in Excel enables companies to monitor budgets and analyze financial data easily. Regardless of an organization’s shape or size, the template provides teams and departments with a user-friendly way to collect and share financial data.

What is an Excel-based workflow template?

Above all, Sheetgo’s budget vs. actual Excel template provides you with a complete and systematic solution.

Your company’s data remains private and secure because the manager controls access to specific data.

Accordingly, teams enter and share data in separate spreadsheets. Meanwhile, the team leader or manager has access to various automated financial reports.

Cómo obtener la plantilla de gestión de proyectos para Excel

Para empezar, sigue estos pasos:

  1. Haga clic en el botón Obtener plantilla botón.
  2. Download the template and follow the instructions within to get started.

Step 1: Select the correct year

En primer lugar, vaya a la página Entradas tab and enter the year you wish to analyze.

Budget vs Actual Template Excel Instructions 3

Step 2: Set up the Income sheet

Now, go back to the Ingresos sheet and overwrite the sample data with your information.

Budget vs Actual Template Excel Income 4

Enter the company’s income sources in the Categories Input ficha.

Next, fill out the Forecast Detail tab and enter how much income each category should generate each month.

Afterwards, delete the sample data in the Income Detail tab. Every time an invoice is paid, the person responsible should log it here. 

Empiece a seguir su presupuesto vs real

Check out the automated income reports

The other tabs (Actual vs Forecast, Yearly Income y Yearly Forecast) generate automatic reports once your colleague(s) have started entering their forecast and income data.

budget vs actual template excel - actual vs forecast income

Step 3: Set up the Expense sheet

Abra el Gastos sheet and, similar to the Ingresos sheet, enter the expenses categories in the Categories input.

En el Budget Detail sheet, enter the monthly budget allocated for expenses.
Then, in the Expenses Detail sheet, enter the actual amount spent every time a bill or invoice is paid.

The template automatically combines the budget and actual data to generate the Yearly Expenses, Actual vs Budget, y Yearly Budget reports.

Budget vs Actual Template Excel Expenses 5

Empiece a seguir su presupuesto vs real

● Disponible 24/7

Pon a Owen a cargo de tus operaciones financieras

Sheetgo's finance empleado virtual keeps your numbers current and your reporting on time. Your data stays in Google Sheets; you work with Owen in Slack, Teams, or Google Chat.

También te puede gustar...

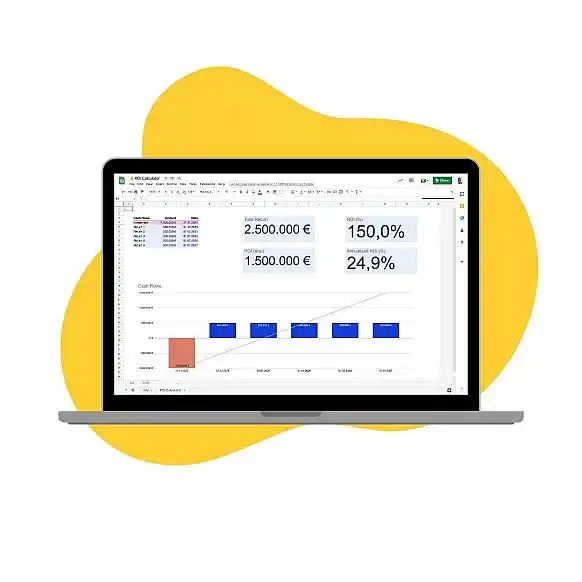
Plantilla de calculadora de ROI en Google Sheets: portátil con una hoja de cálculo de ROI con un ROI del 150 % y un gráfico de flujos de caja sobre fondo amarillo

Plantilla de calculadora de ROI en Google Sheets

Crea una plantilla de ROI en Google Sheets con fórmulas para el rendimiento total, el ROI y el ROI anualizado, y aprende a calcular el ROI en marketing y en el sector inmobiliario.

Caso de negocio: maletín morado con documentos y un lápiz rojo sobre fondo gris

Cómo escribir un caso de negocio (con plantilla y ejemplos)

Aprende a escribir un caso de negocio, desde el planteamiento del problema hasta el análisis financiero, con ejemplos, tipos de análisis y consejos para presentarlo.

Plantilla de presupuesto de Google Sheets imagen destacada

Plantilla de presupuesto de Google Sheets: Top 5 para 2026

Tanto si tienes 19 años como 59 o si manejas el dinero personal o profesionalmente, es esencial contar con un sistema sólido de elaboración de presupuestos. Con Google Sheets...