Obtener ayuda

Centro de ayuda

Guías y respuestas

Contactar con el servicio de asistencia

Escribir a nuestro equipo

Iniciar sesión en

Workflows

Crear procesos con su equipo

Automations

Conectar archivos y automatizar tareas

Un sistema, cuatro partes

Agentes de IA

Empleados virtuales que trabajan 24/7

Automations

Conectar archivos y automatizar tareas

Workflows

Crear procesos con su equipo

Data Space

Datos compartidos y controlados con confianza

Soluciones por departamento

Finanzas

Informes, presupuestos y conciliaciones

Inventario y fabricación

Existencias, pedidos y producción en una sola vista

RRHH

Hojas de horas, asistencia y evaluaciones

Gestión de proyectos

Estado y carga de trabajo de todos los proyectos

Ventas y CRM

Leads y oportunidades al día

Educación

Expedientes de alumnos y datos escolares

Finanzas

Convierta el trabajo financiero manual en informes que se actualizan solos.

Qué automatizan los equipos de Finanzas

  • Controlar cuentas por pagar y cobrar
  • Crear estados de flujo de caja
  • Comparar presupuesto y resultados reales

Inventario y fabricación

Vea los niveles de existencias y automatice los pedidos.

Qué automatizan los equipos de inventario y fabricación

  • Controlar el inventario en varias sedes
  • Conectar datos de ventas, compras y almacén
  • Vincular un lector de códigos de barras a su hoja

RRHH

Gestione la contratación, la asistencia y el seguimiento de OKR desde sus hojas.

Qué automatizan los equipos de RRHH

  • Controlar contratación e incorporación
  • Registrar los OKR y resultados del equipo
  • Controlar entradas, salidas y ausencias

Gestión de proyectos

Asigne tareas y controle las horas sin actualizaciones manuales.

Qué automatizan los equipos de proyectos

  • Asignar tareas y seguir los cambios de estado
  • Estimar el esfuerzo y registrar las horas trabajadas
  • Seguir los hitos de todos los proyectos

Ventas y CRM

Siga los leads y el rendimiento de ventas con informes automáticos.

Qué automatizan los equipos de ventas

  • Seguir y convertir leads
  • Fijar objetivos de ventas y seguir las métricas del equipo
  • Supervisar los KPI de ventas en tableros

Educación

Automatice asistencia, calificaciones y compras escolares.

Qué automatizan los centros educativos

  • Controlar la asistencia y avisar a los padres
  • Registrar y comparar las notas de clase
  • Controlar el material prestado a alumnos y personal

Buscar un caso de uso

Por departamento

Cómo usa Sheetgo cada equipo

Por sector

Cómo usa Sheetgo cada sector

Por tamaño de empresa

Pequeña, mediana o grande

Aprende

Blog

Guías y novedades del producto

Historias de clientes

Cómo usan Sheetgo equipos como el suyo

Centro de ayuda

Guías y respuestas

Por qué Sheetgo

Comparar

Cómo se compara Sheetgo con otras herramientas

Seguridad

Cómo protegemos sus datos

Centro de confianza

Detalles de cumplimiento

Iniciar sesión en

Workflows

Crear procesos con su equipo

Automations

Conectar archivos y automatizar tareas

Un sistema, cuatro partes

Agentes de IA

Empleados virtuales que trabajan 24/7

Automations

Conectar archivos y automatizar tareas

Workflows

Crear procesos con su equipo

Data Space

Datos compartidos y controlados con confianza

Soluciones por departamento

Finanzas

Informes, presupuestos y conciliaciones

Inventario y fabricación

Existencias, pedidos y producción en una sola vista

RRHH

Hojas de horas, asistencia y evaluaciones

Gestión de proyectos

Estado y carga de trabajo de todos los proyectos

Ventas y CRM

Leads y oportunidades al día

Educación

Expedientes de alumnos y datos escolares

Buscar un caso de uso

Por departamento

Cómo usa Sheetgo cada equipo

Por sector

Cómo usa Sheetgo cada sector

Por tamaño de empresa

Pequeña, mediana o grande

Empezar

Plantillas

Flujos de trabajo listos para usar

Aprende

Blog

Guías y novedades del producto

Historias de clientes

Cómo usan Sheetgo equipos como el suyo

Centro de ayuda

Guías y respuestas

Por qué Sheetgo

Comparar

Cómo se compara Sheetgo con otras herramientas

Seguridad

Cómo protegemos sus datos

Centro de confianza

Detalles de cumplimiento

Centro de ayuda

Guías y respuestas

Contactar con el servicio de asistencia

Escribir a nuestro equipo

Workflows

Crear procesos con su equipo

Automations

Conectar archivos y automatizar tareas

Cómo utilizar la fórmula NORMSDIST en Google Sheets

En este artículo aprenderás a calcular la distribución normal acumulada con la fórmula NORMSDISTa in Google Sheets. The normal cumulative distribution is one of the most widely used probability distributions in statistics. We can derive a specialized case of normal cumulative distribution when mean is zero and the variance is 1. This is called the standard normal cumulative distribution function. Here’s how the function looks like when we plot it on the graph – the red curve is what we have been talking about.
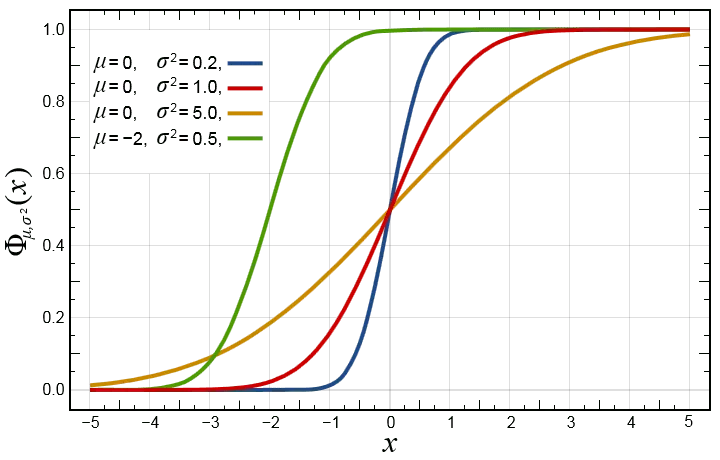
NORMSDIST Formula

Now, if we were to know the value of the standard normal cumulative distribution function against the normally distributed variable (x), we can use the NORMSDIST en Google Sheets.


Sintaxis

NORMSDIST(x)

  • x – is the input value or cell reference that we pass to the standard normal cumulative distribution function.

The formula has one of the simplest syntaxes in all of Google Sheets. All it takes is the value of one single parameter, and it returns the value of the standard normal cumulative distribution function corresponding to that input value.

Usage: NORMSDIST formula in Google Sheets

Now that we learned the syntax, let us practically apply the formula in Google Sheets application. And we may compare the graph with that of the output values. Please have a look at the following snapshot.

NORMSDIST Formula: Usage

Like most other Google Sheets formulas, the NORMSDIST formula also is capable of accepting direct numeric values. And also references to the cells consisting of these numeric values. The first example has an input that is a direct numeric value. Whereas all other examples have cell references for its input.

Now let’s observe the output values the formula returned. If we made a quick comparison of the output values against those in the graph, it certainly looks the same. We can get a little creative and try to plot these output values on a graph using Google Sheets charts. And here’s how it looks like.

NORMSDIST Formula in Google Sheets

Without a doubt, it does resemble the red curve graph shown in the very first image.

This is how you use the NORMSDIST formula in Google Sheets. Note that there is also a way to do the opposite. That is to find the value of the distributed variable, given the value of the distribution itself. The NORMSINV formula in Google Sheetshelps us achieve this calculation.

También te puede gustar...

funciones y fórmulas de google sheets

Cómo hallar el tipo de interés nominal con Google Sheets

Sarah es una joven profesional que toma importantes decisiones financieras. Desde tarjetas de crédito a hipotecas, préstamos estudiantiles e inversiones...
funciones y fórmulas de google sheets

Extraer datos de Google Calendar en Google Sheets mediante Apps Script

Este post fue publicado originalmente en nuestro foro de la comunidad. Objetivo : Esta guía muestra cómo utilizar Google Apps Script para extraer datos...
funciones y fórmulas de google sheets

Uso de la función PROPER para escribir en mayúsculas la primera letra de cada palabra en Google Sheets

Nota: Este artículo se publicó originalmente en el foro de nuestra comunidad. Alguna vez te has visto en la necesidad de limpiar una lista de nombres, títulos o cualquier...